NOTE
The following document, from start to finish, is an exemplar that exists to describe one process for building a multi-user application backed by an online database, while correlating the sub-tasks to the Ontario achievement chart for Computer Studies.
Thinking
From the Ontario curriculum document for Computer Studies (2009), this entails:
The use of critical and creative thinking skills and/or processes:
- Use of planning skills (e.g., focusing research, gathering information, selecting strategies, organizing a project)
- Use of processing skills (e.g., analysing, interpreting, assessing, reasoning, evaluating, integrating, synthesizing)
- Use of critical/creative thinking processes (e.g., evaluation of computer solutions, problem solving, decision making, detecting and correcting flaws, research)
Success criteria for this portion of the task:
- purpose, audience, and beneficial effect of an app are clearly identified
- a complete user interface prototype, either paper-based or made with presentation or design software, is built
- end-user feedback is obtained and has clearly been integrated into a revised prototype
Purpose
What is the purpose of the app? What problem does it solve?
The purpose of my app, Bone Appétit, is to allow groups of people who care for one or more animals to define a feeding schedule for each animal and to keep track of whether a given animal has been fed according to their defined schedule. The problem that my app solves is eliminating the need for constant co-ordination within a group of people (whether this be verbal or through a text-message stream) to figure out whether the dog, cat, or other pet, has been fed yet.
Audience
Who is the audience for your app?
Any group of people who care for at least one animal. This could involve a family or even colleagues who work at an animal shelter.
Beneficial Effect
What is the beneficial effect of your app for that audience?
My app ensures that a given animal is fed when it should be, and reduces the need for sometimes tedious communication within a group of people regarding whether an animal has been fed or not.
Prototype
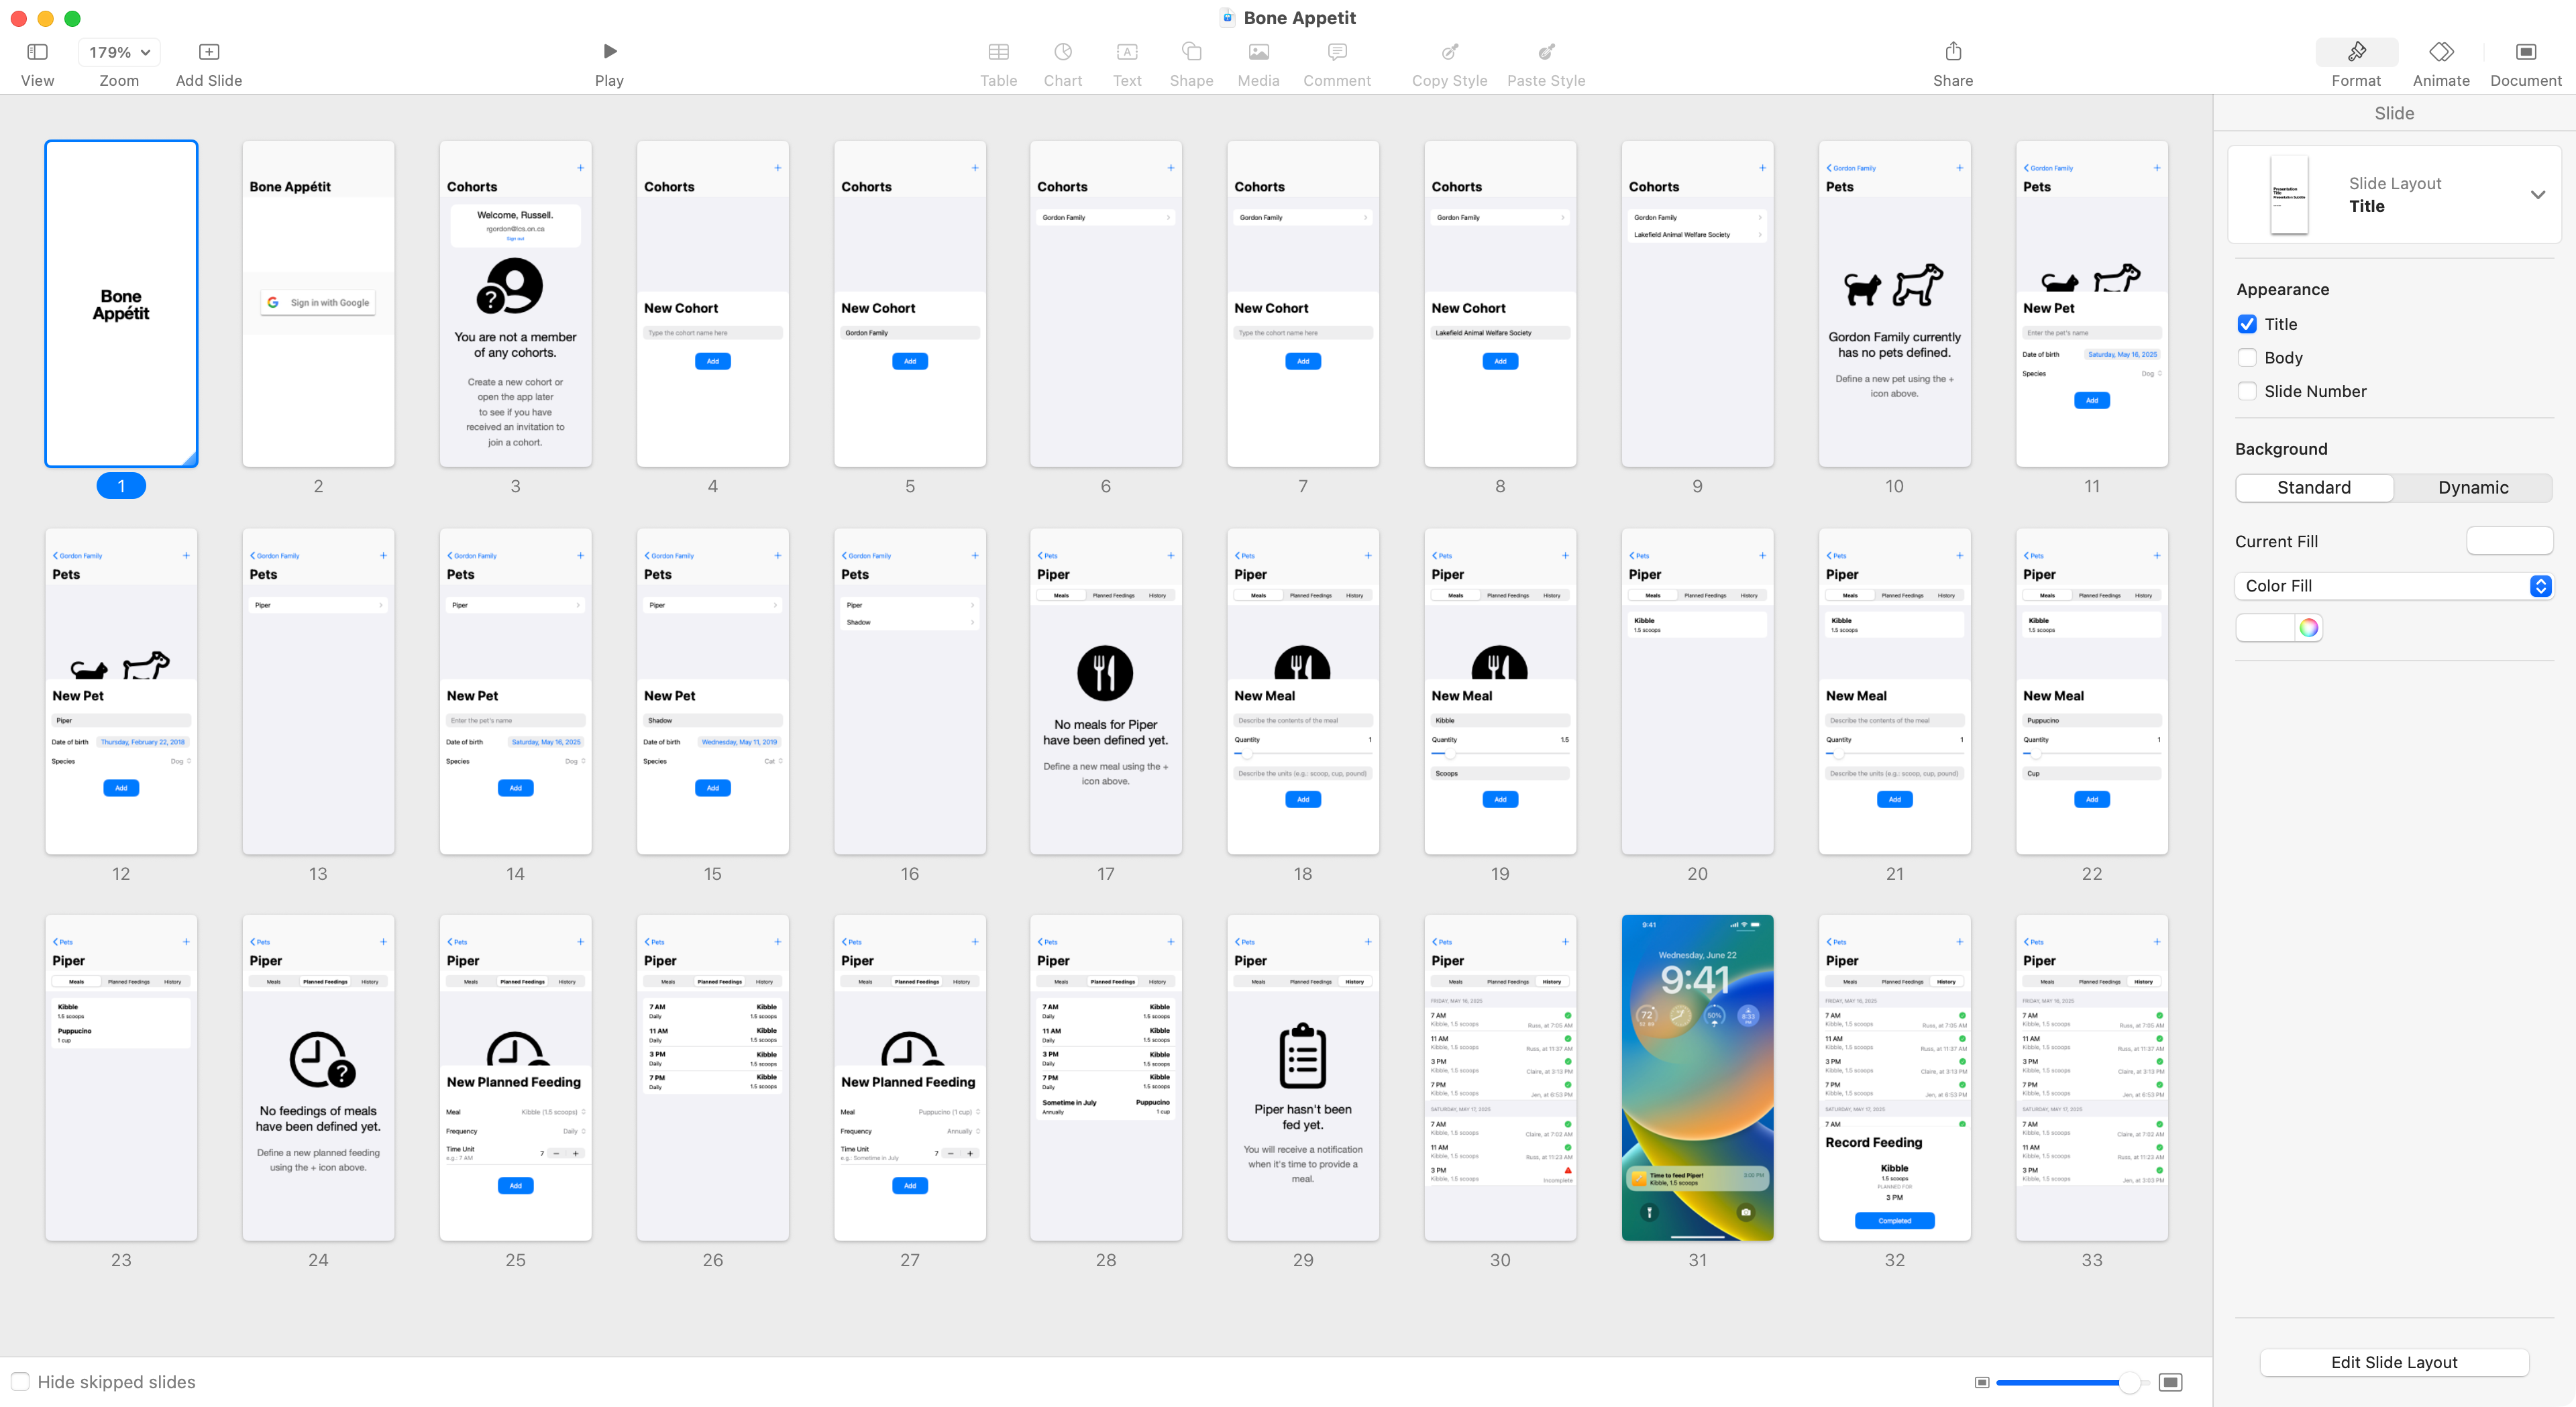
The original prototype of this app was built in Keynote and also made use of these iOS design elements.
Here is an overview of all the screens available in the prototype:
TIP
Here is a video showing exactly how this prototype was built in Keynote:
The video above is just over two hours long.
No one is expected to watch this from start to finish – but you may find certain techniques in using Keynote useful.
Keyboard shortcuts are displayed on screen so you can learn from how the Keynote deck is built by watching parts of this video.
Peer Feedback
Before starting to write code, it is vital to get feedback on our plan to ensure that a prototype suitably addresses the stated purpose.
Using the “think aloud” approach, show your prototype to at least one other person.
Although some verbal explanation by you, the prototype developer, will be necessary, encourage the person reviewing your prototype to describe what they see, and what they think will happen, as they try out your prototype.
Here is a video showing what a 10-minute peer feedback session might look and sound like:
Here are the notes taken during this prototype review, describing changes or additions that could be made:
- Come up with a login method that is not linked to using Google
- Explain what the term “cohort” means within the context of the app
- Be certain that users can pause being notified of when a given pet has been fed or needs to be fed.
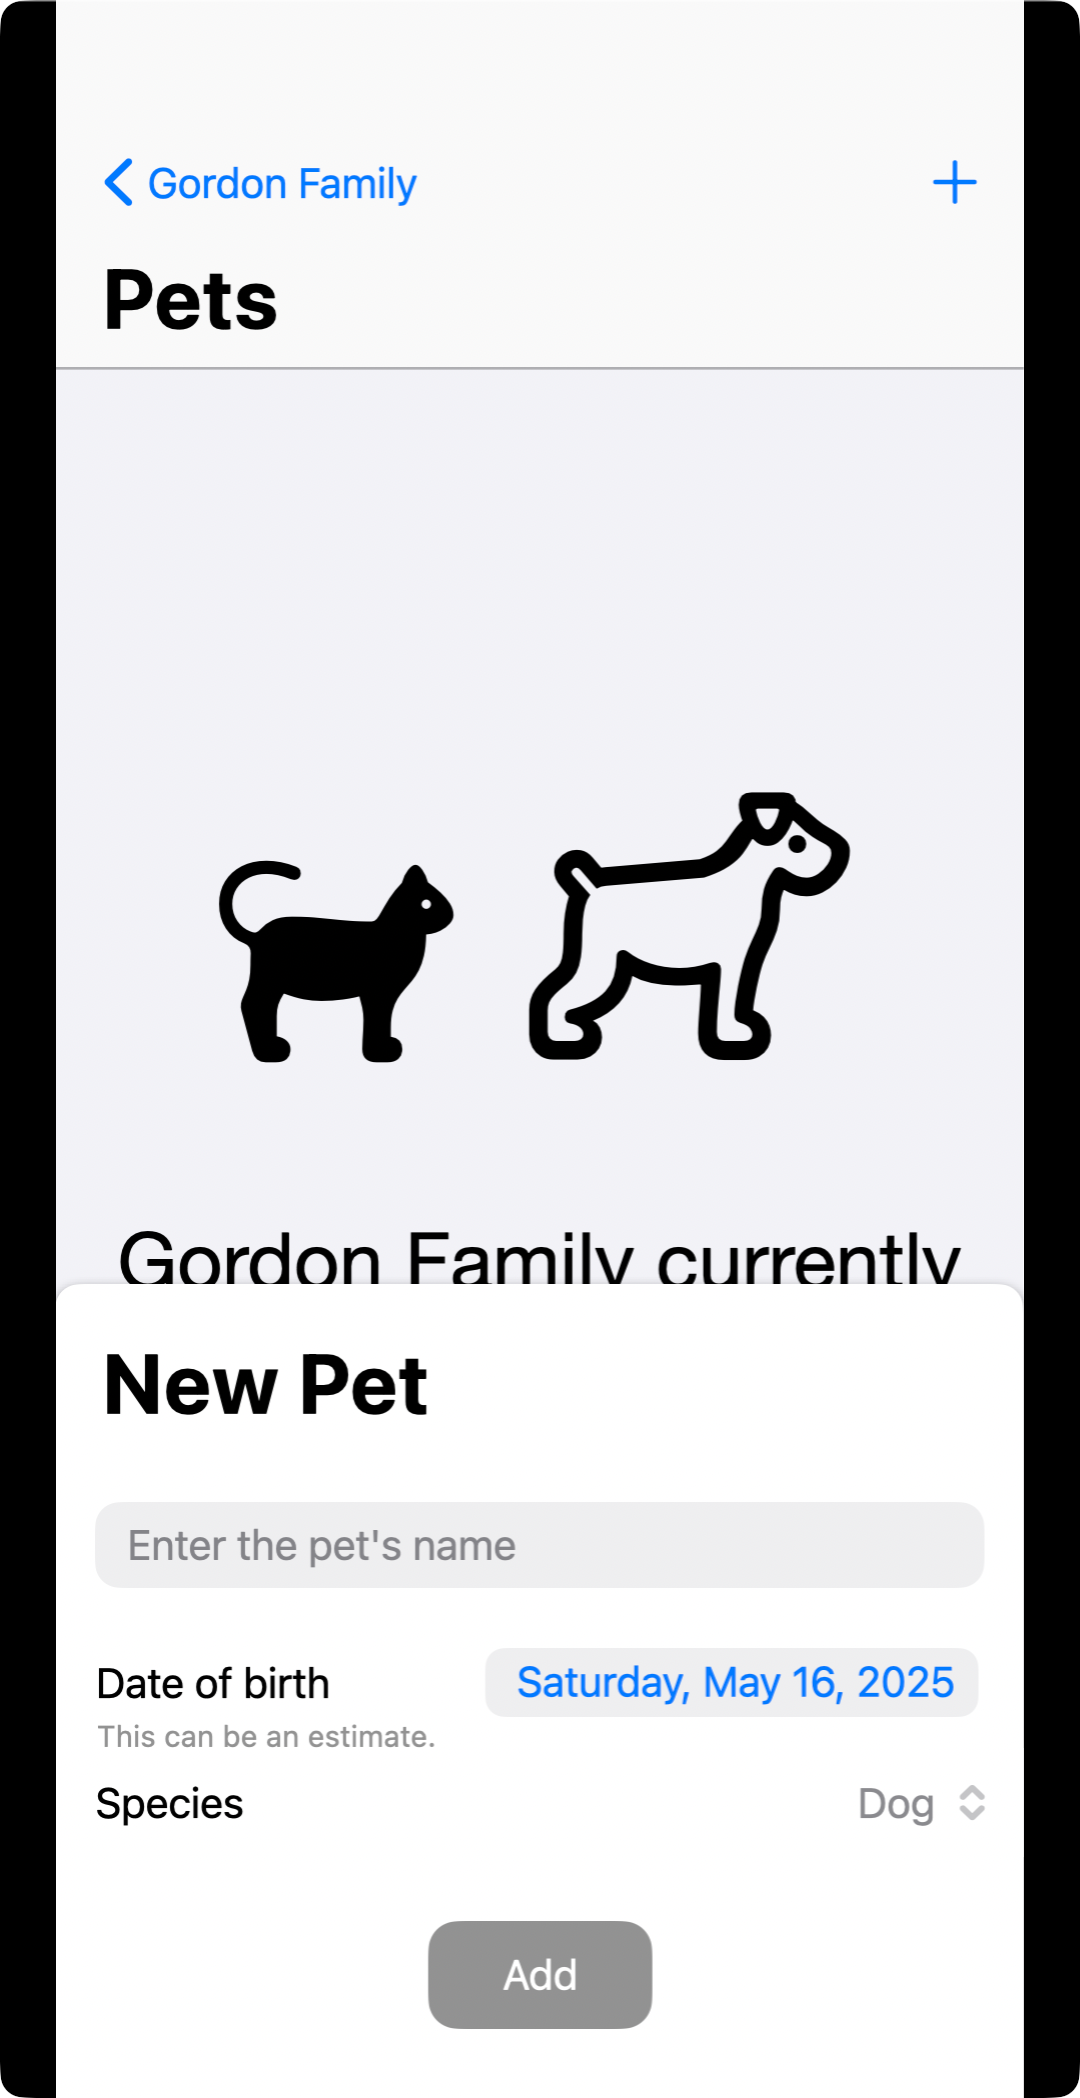
- Indicate that a precise date of birth for a pet is not required – an estimate is OK.
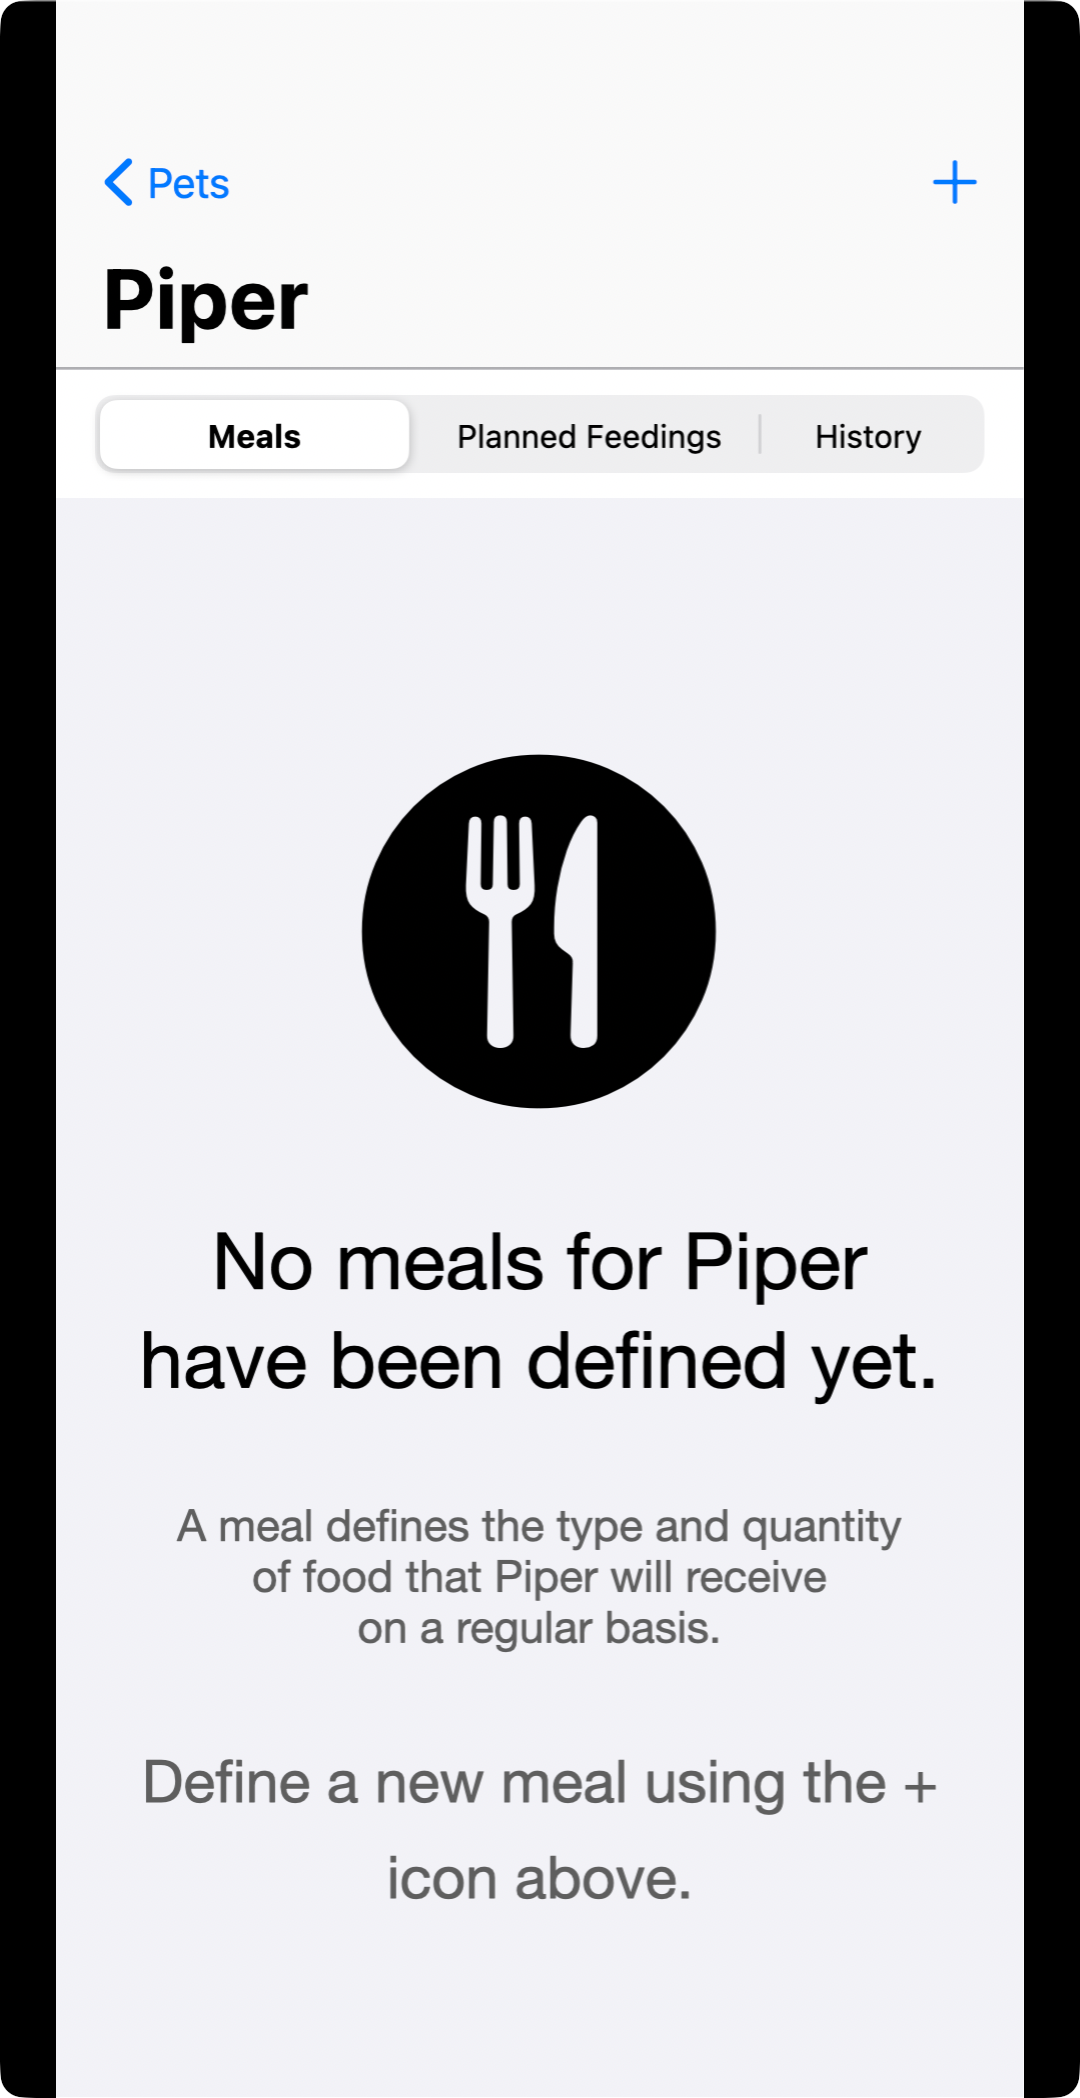
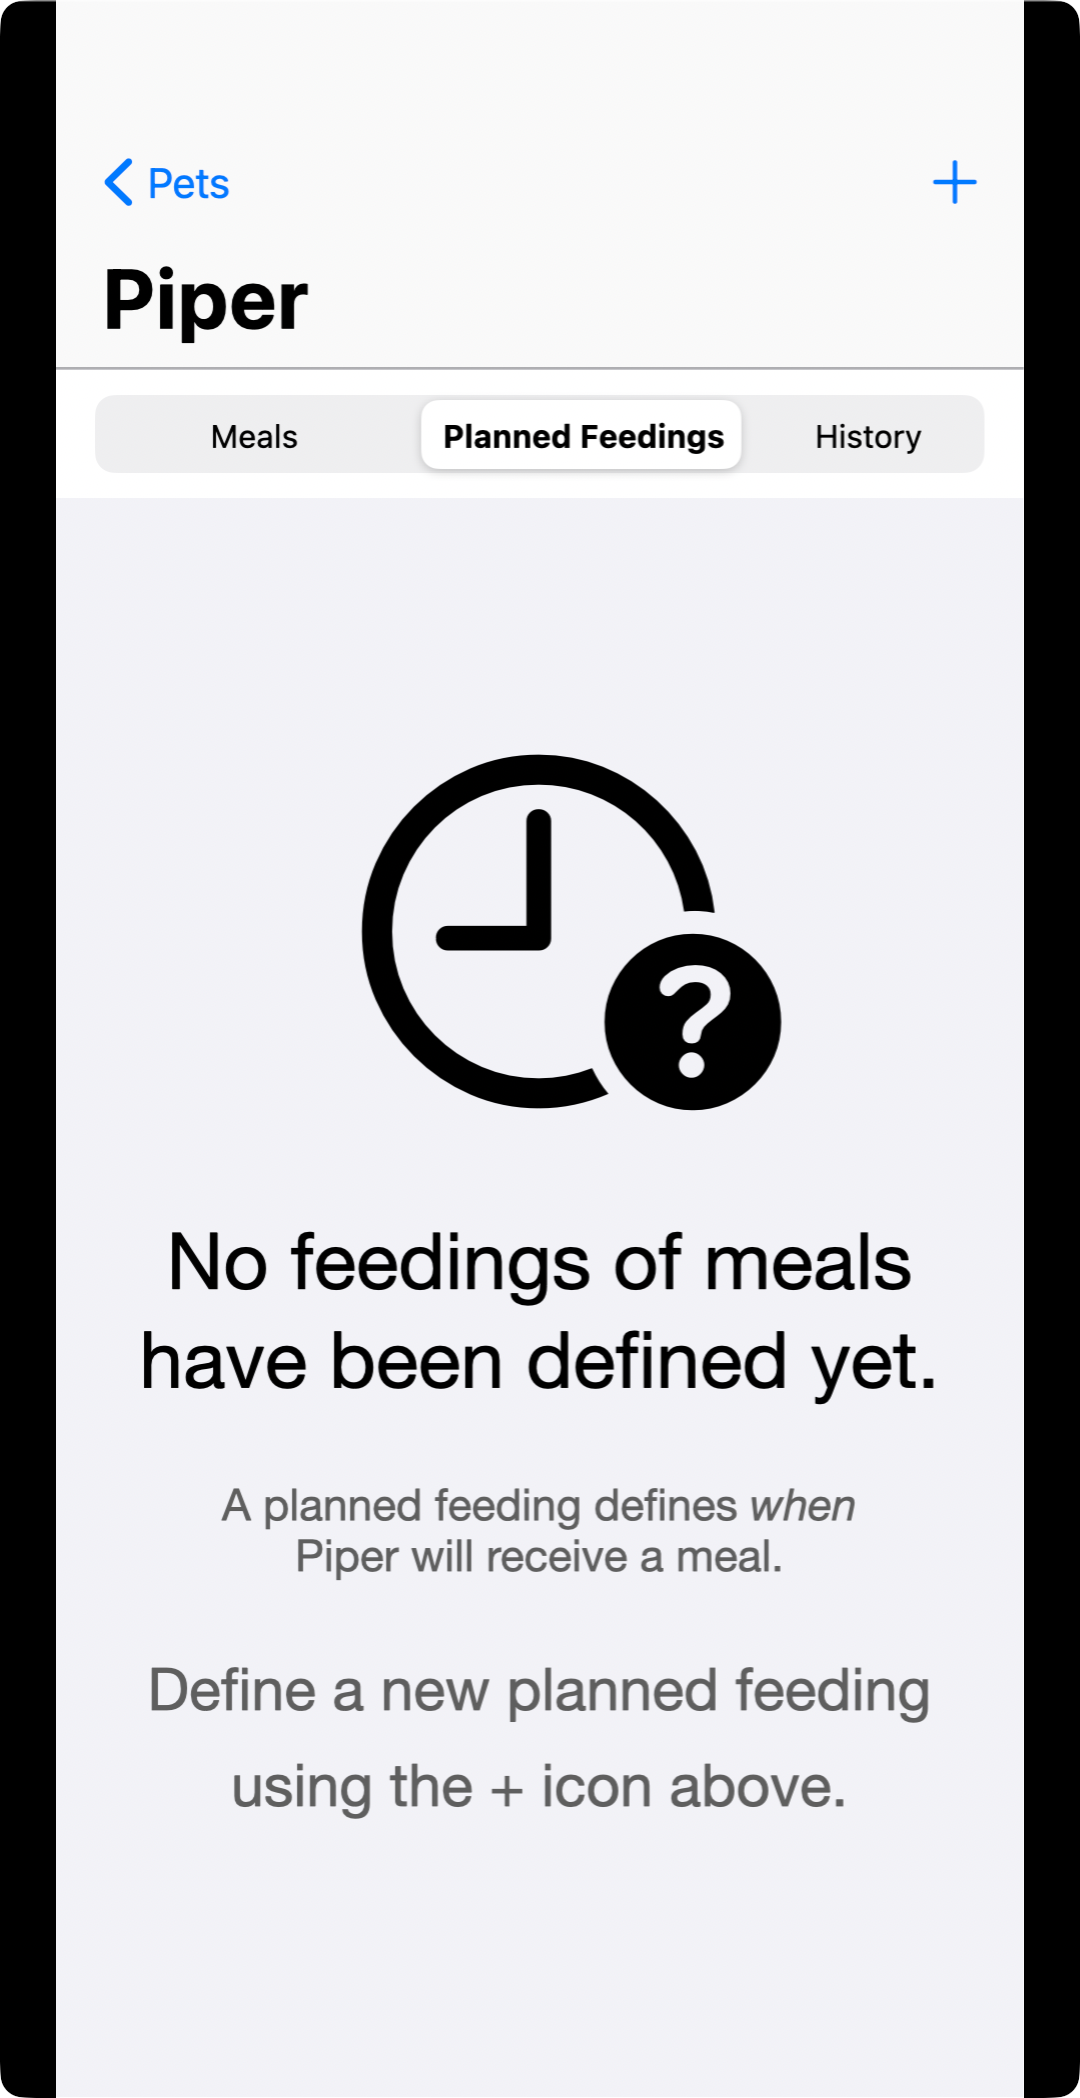
- Better explain what a “meal” as compared to a “planned feeding” means.
- Consider setting up a planned feeding in a manner that is similar to how you create a repeating calendar event in a typical calendar app.
- Ensure that other people within a cohort are in fact notified when a pet has been fed – especially if they previously received a notification that the time for a planned feeding has arrived. Put another way – if they are told that a pet should be fed – they should also be told that the pet has been fed – so they know they don’t have to do it themselves.
Revised Prototype
Here is an overview of all the screens in the revised prototype:
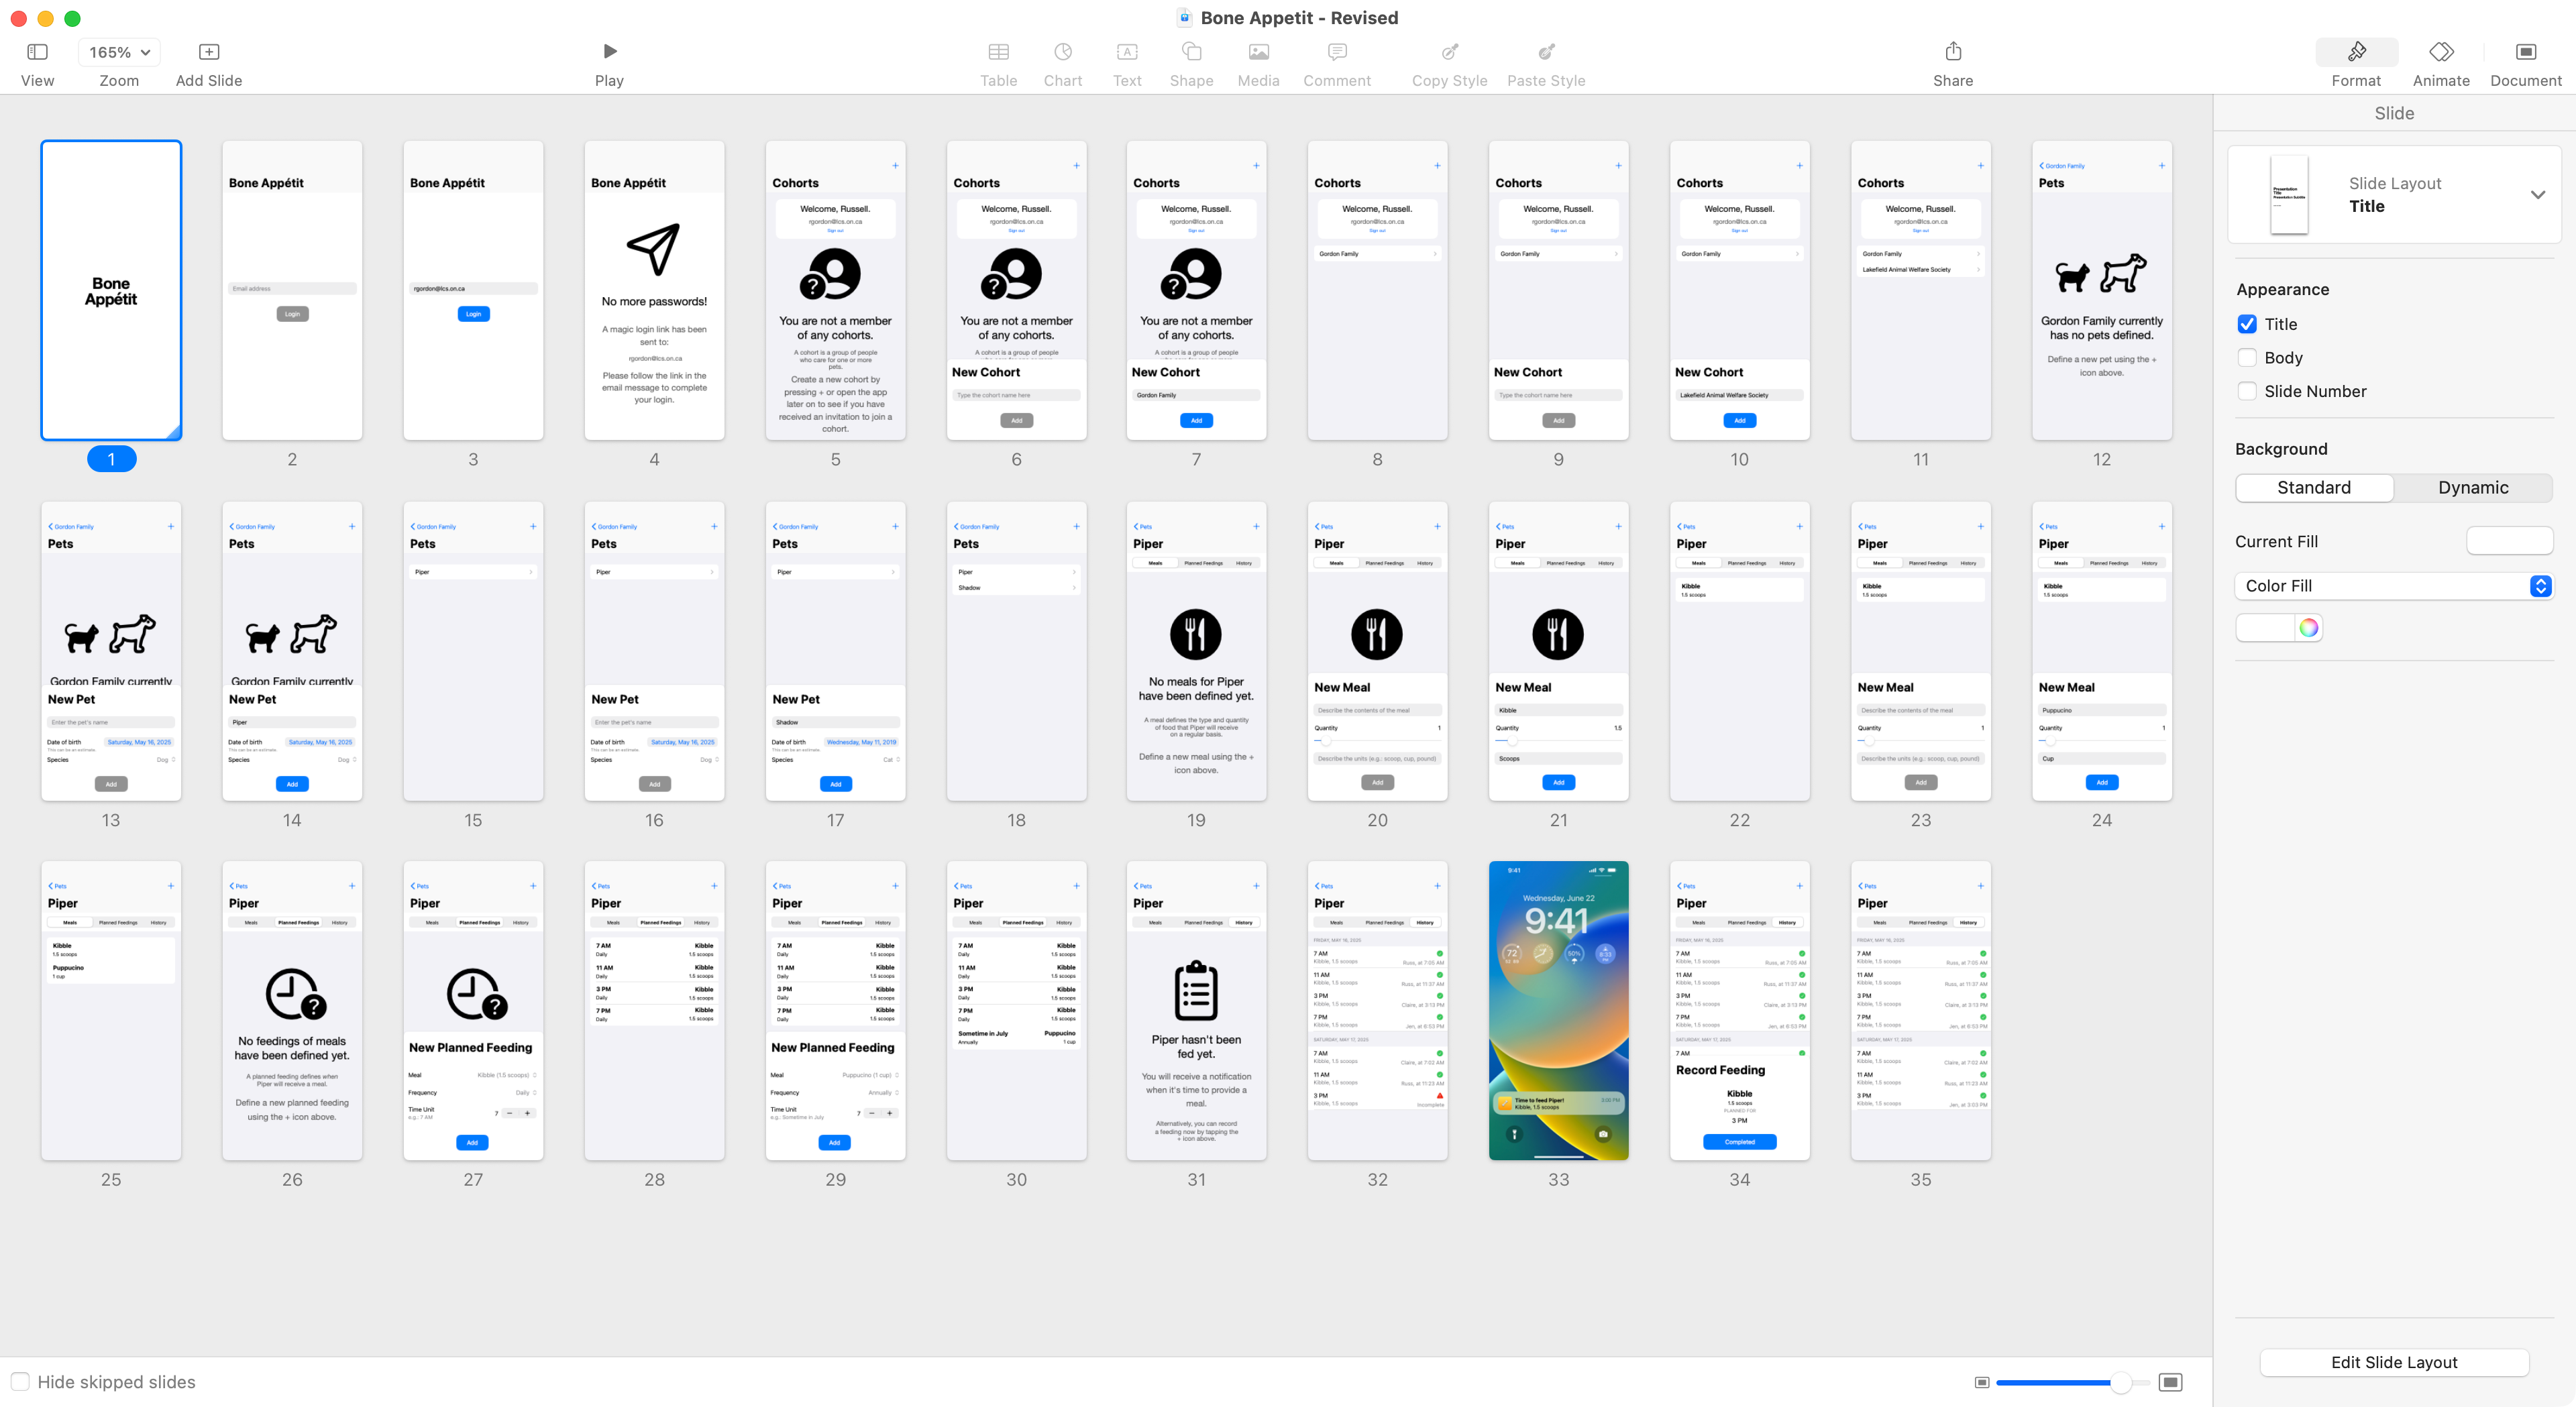
Specifically, the following screens were revised to address feedback received:
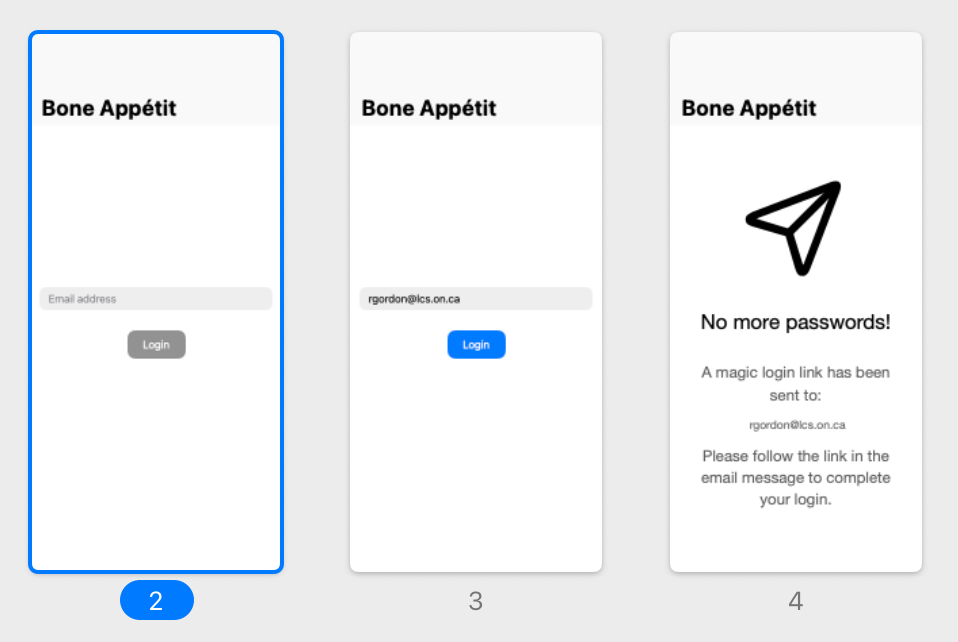
-
Revised login flow – avoids use of a Google account:
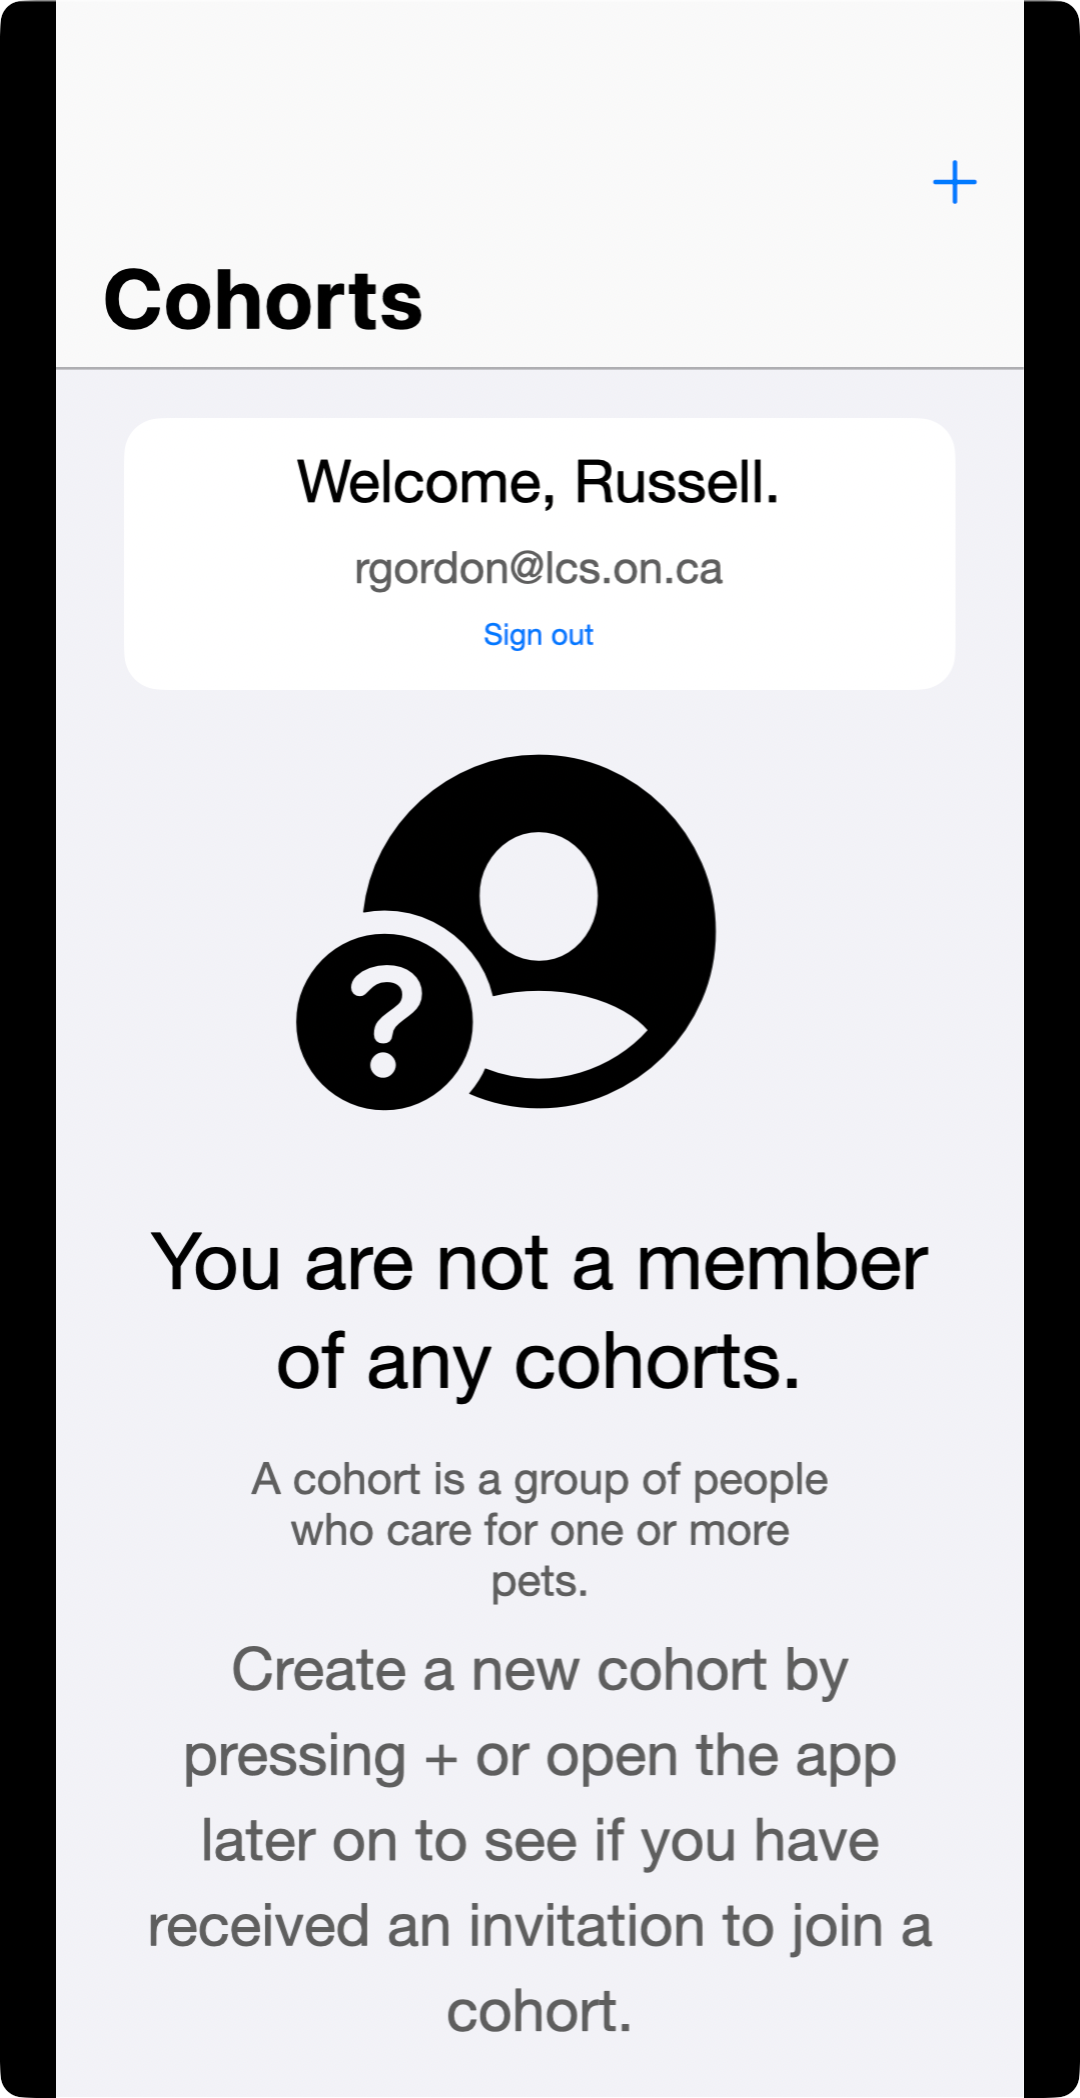
-
Clearly explain what a cohort is:
-
Dates of birth need not be precise:
-
Better explain what a meal and planned feeding represent:
NOTE
Other feedback may be addressed in the finished product – these are the changes that the developer is choosing to implement in their app based on the feedback received.
ER Diagram
You can review a lesson on how to build an ER diagram here.
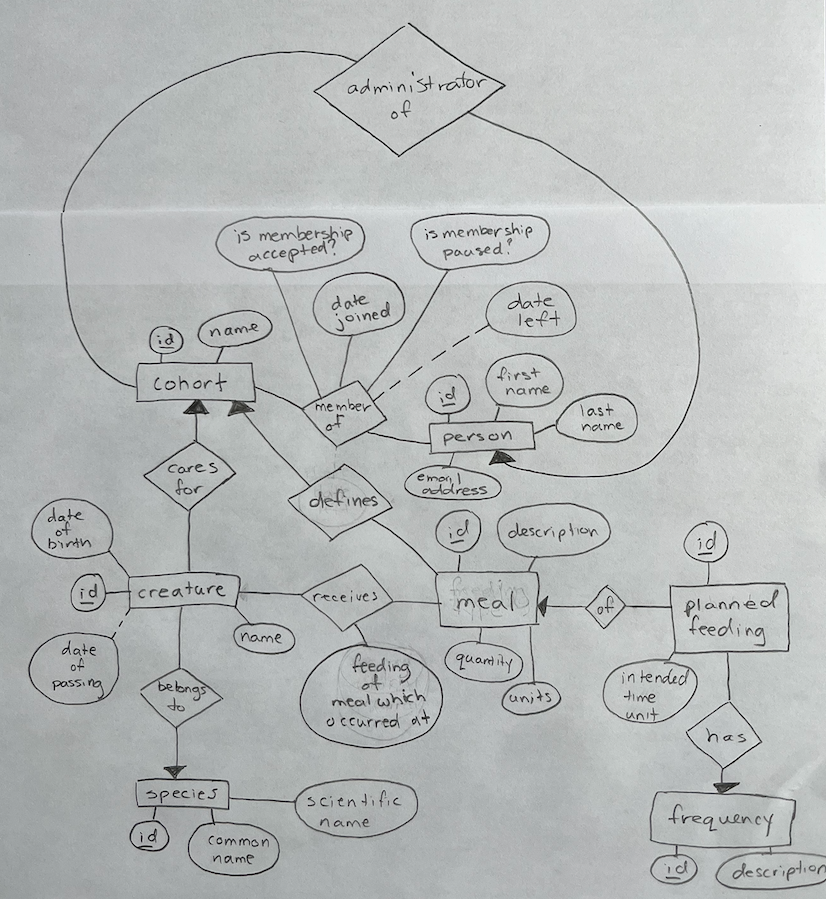
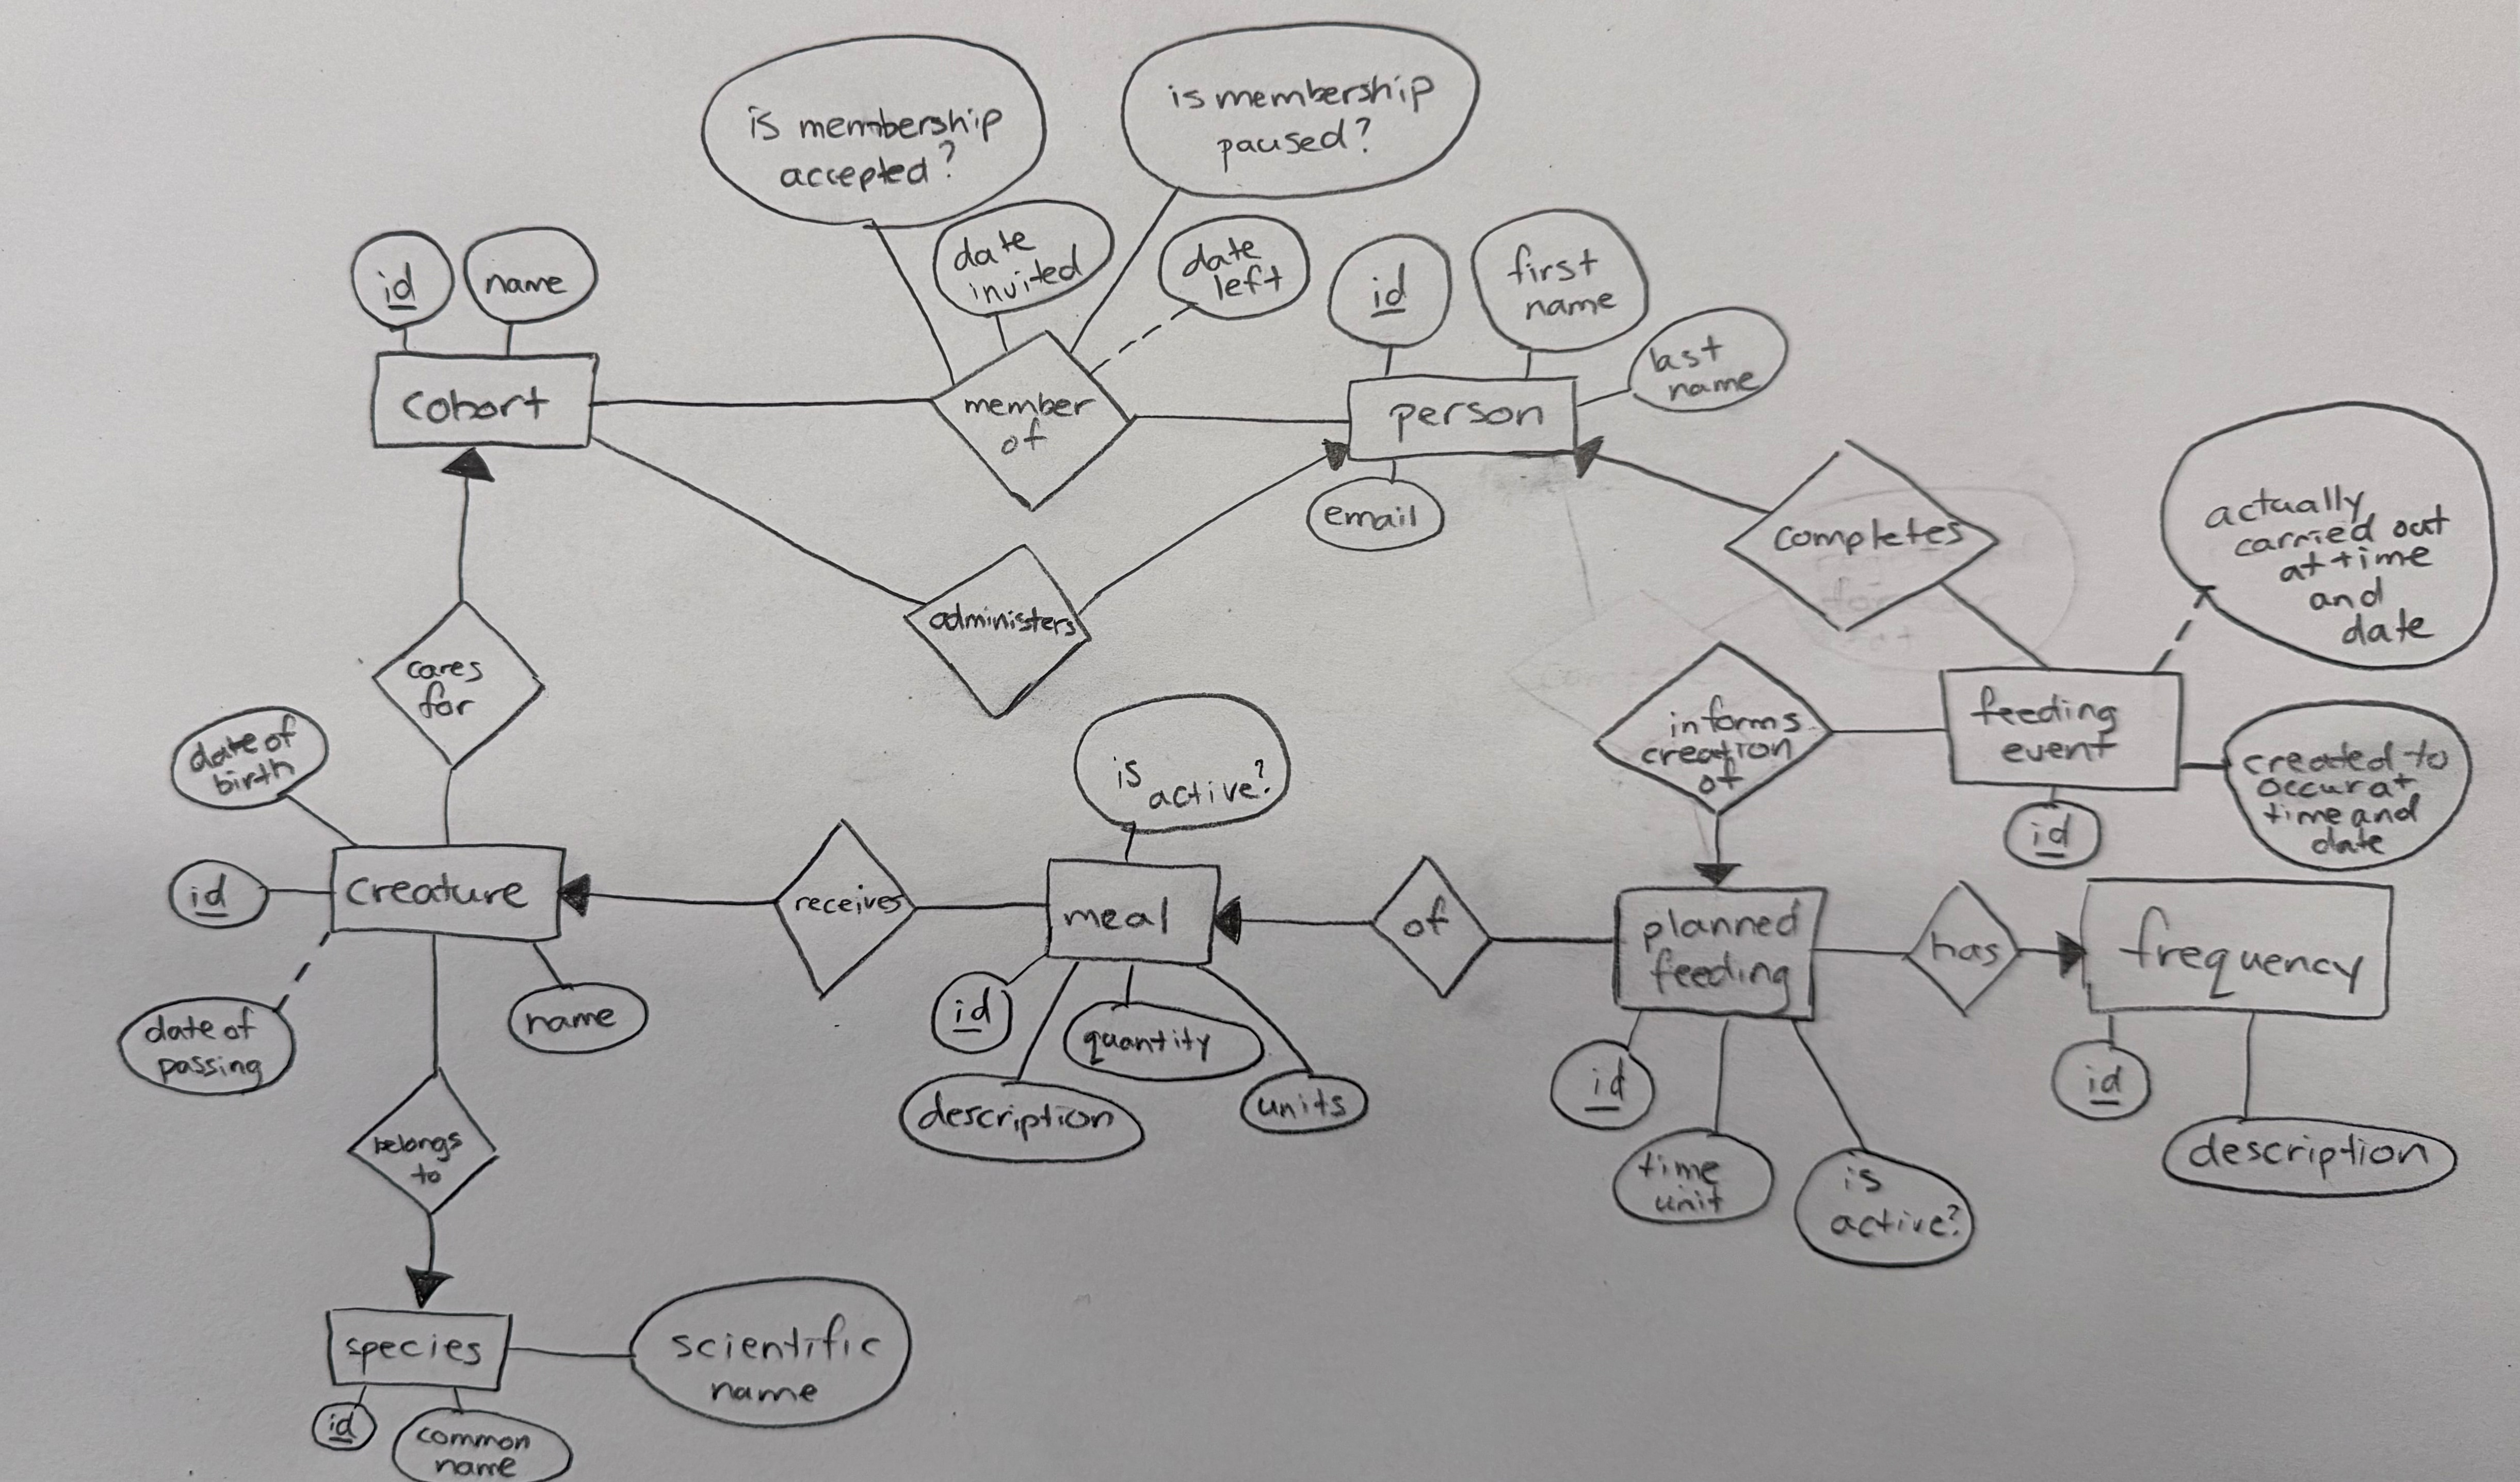
Here is the ER diagram that was initially developed for Bone Appétit, based on reviewing the prototype user interface and considering what type of information it needs to keep track of:
Here is a discussion of the ER diagram and why certain choices were made:
Knowledge
From the Ontario curriculum document for Computer Studies (2009), this entails:
Subject-specific content… and the comprehension of its meaning and significance:
- Knowledge of content (e.g., facts, technical terminology, definitions, procedures, standards)
- Understanding of content (e.g., concepts, principles, methodologies, use of tools)
Success criteria for this portion of the task:
- you can navigate the programming environment (Xcode) largely independently
- you author readable code and create a well-organized Xcode project
- you develop the application over time using source control to make incremental additions to your codebase
- you apply abstraction by making use of custom subviews to avoid repetitive code
Creating a new project in Xcode
The next step is to create a new project in Xcode, then author static interfaces to match the prototype plans made in Keynote.
Next, work to create a user interface, using code, matching the prototype made using paper or design software.
This will not be a functional app – data will not be persisted.
Instead, temporary data is stored in arrays – only what is required to make the user interface interactive.
TIP
Alternatively, data may be hard-coded directly into the views using string literals – this is known as a static interface.
Here is a video demonstrating what the Bone Appétit app currently looks like at the conclusion of the process of building just the user interface:
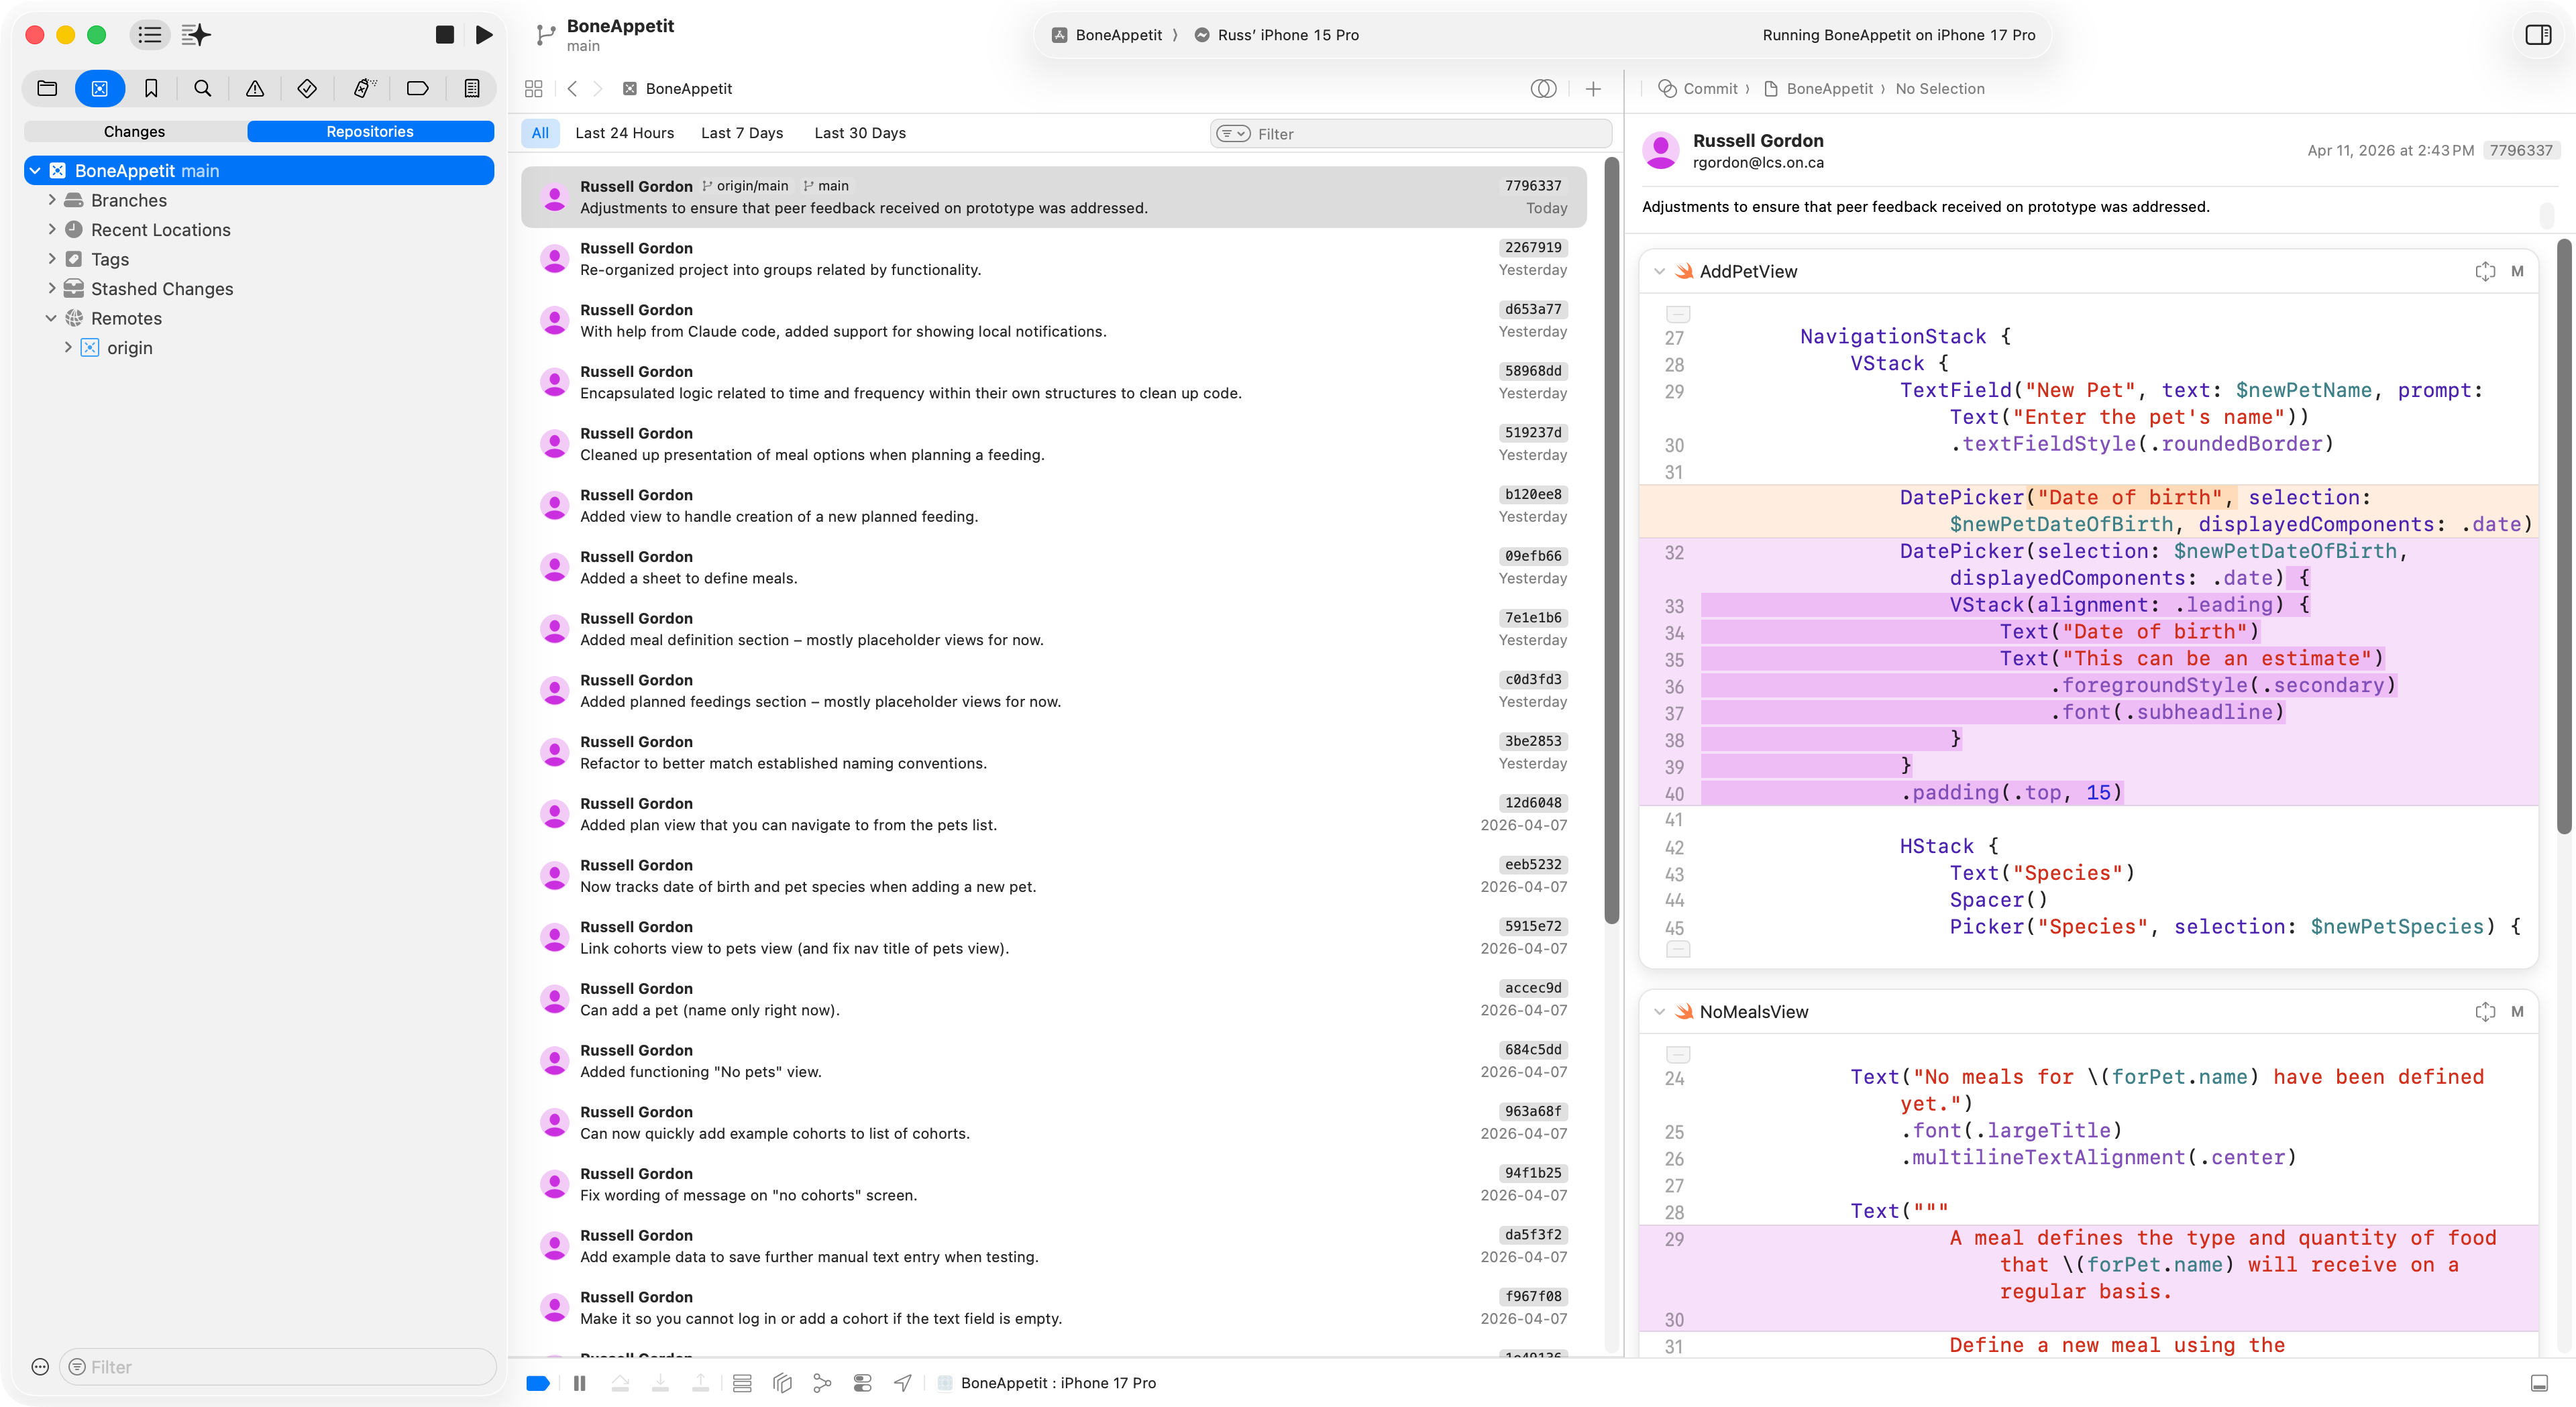
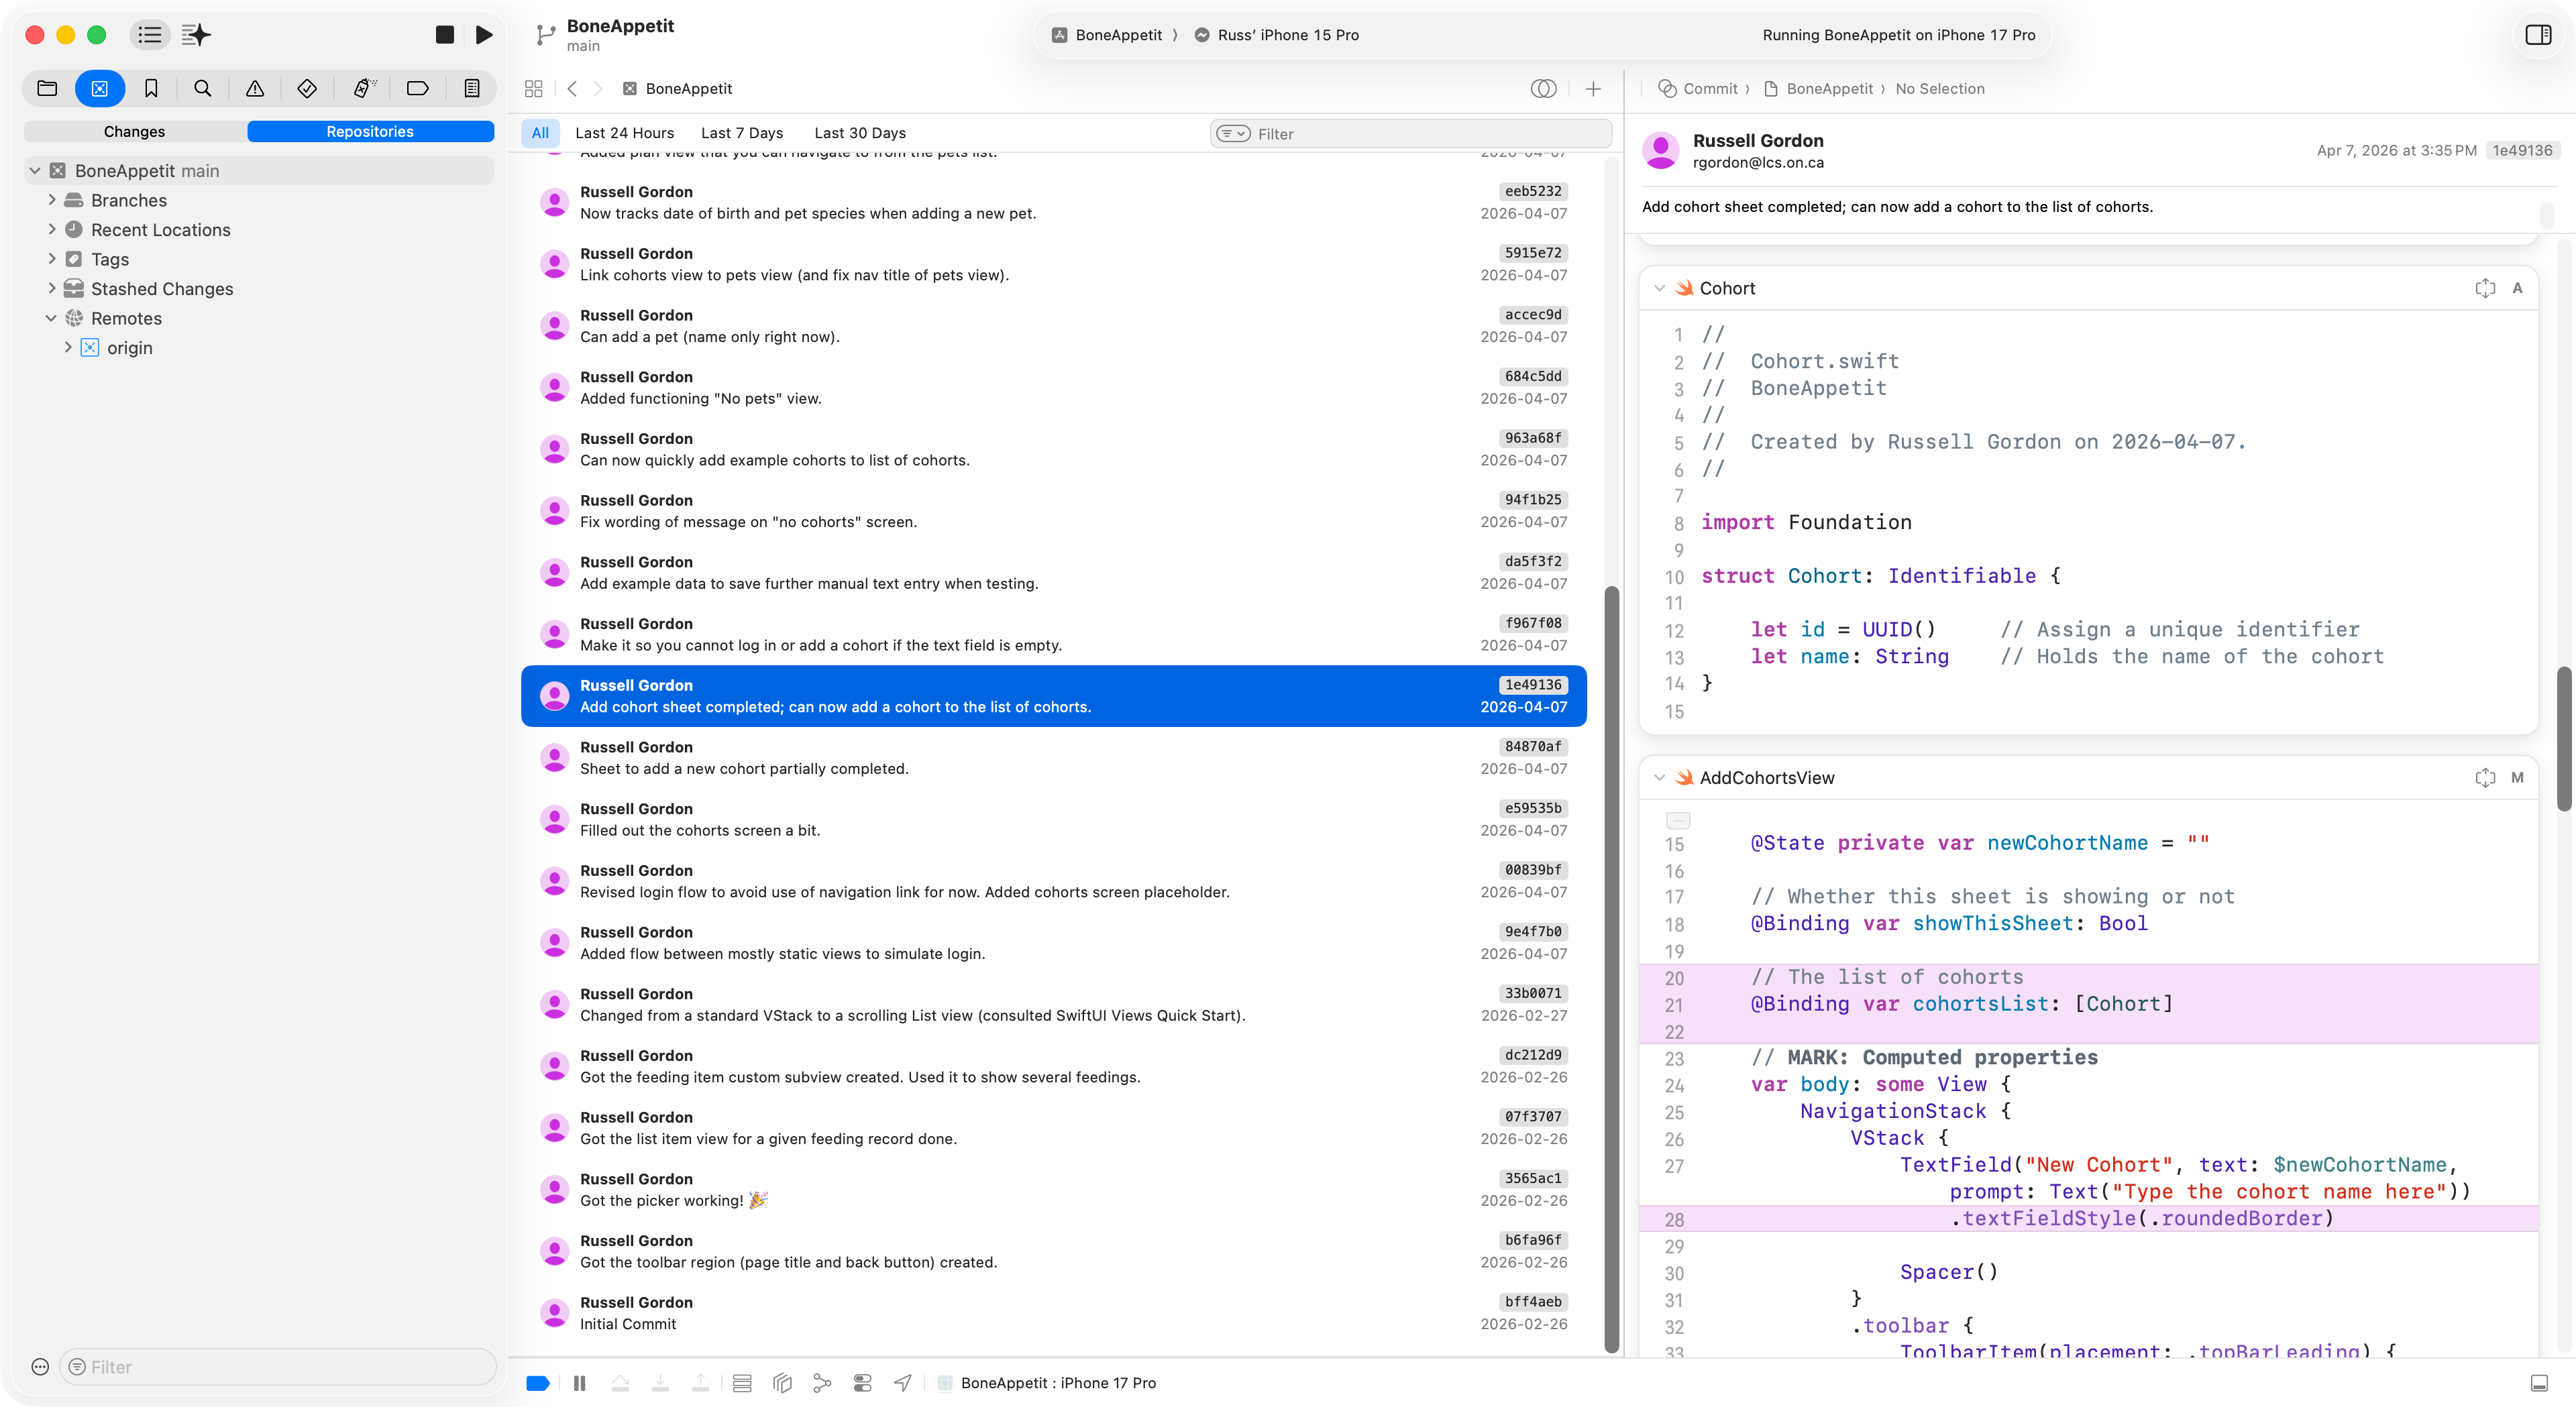
Make appropriate use of source control
This screenshot demonstrates good use of source control – regular commits made with meaningful commit messages:
NOTE
In a shared project at the Grade 12 level, you would use source control as described above, while also adhering to the principles described here for authoring code within a team
Follow naming and style conventions
Here is one example of how files are organized files within his project in a logical manner:
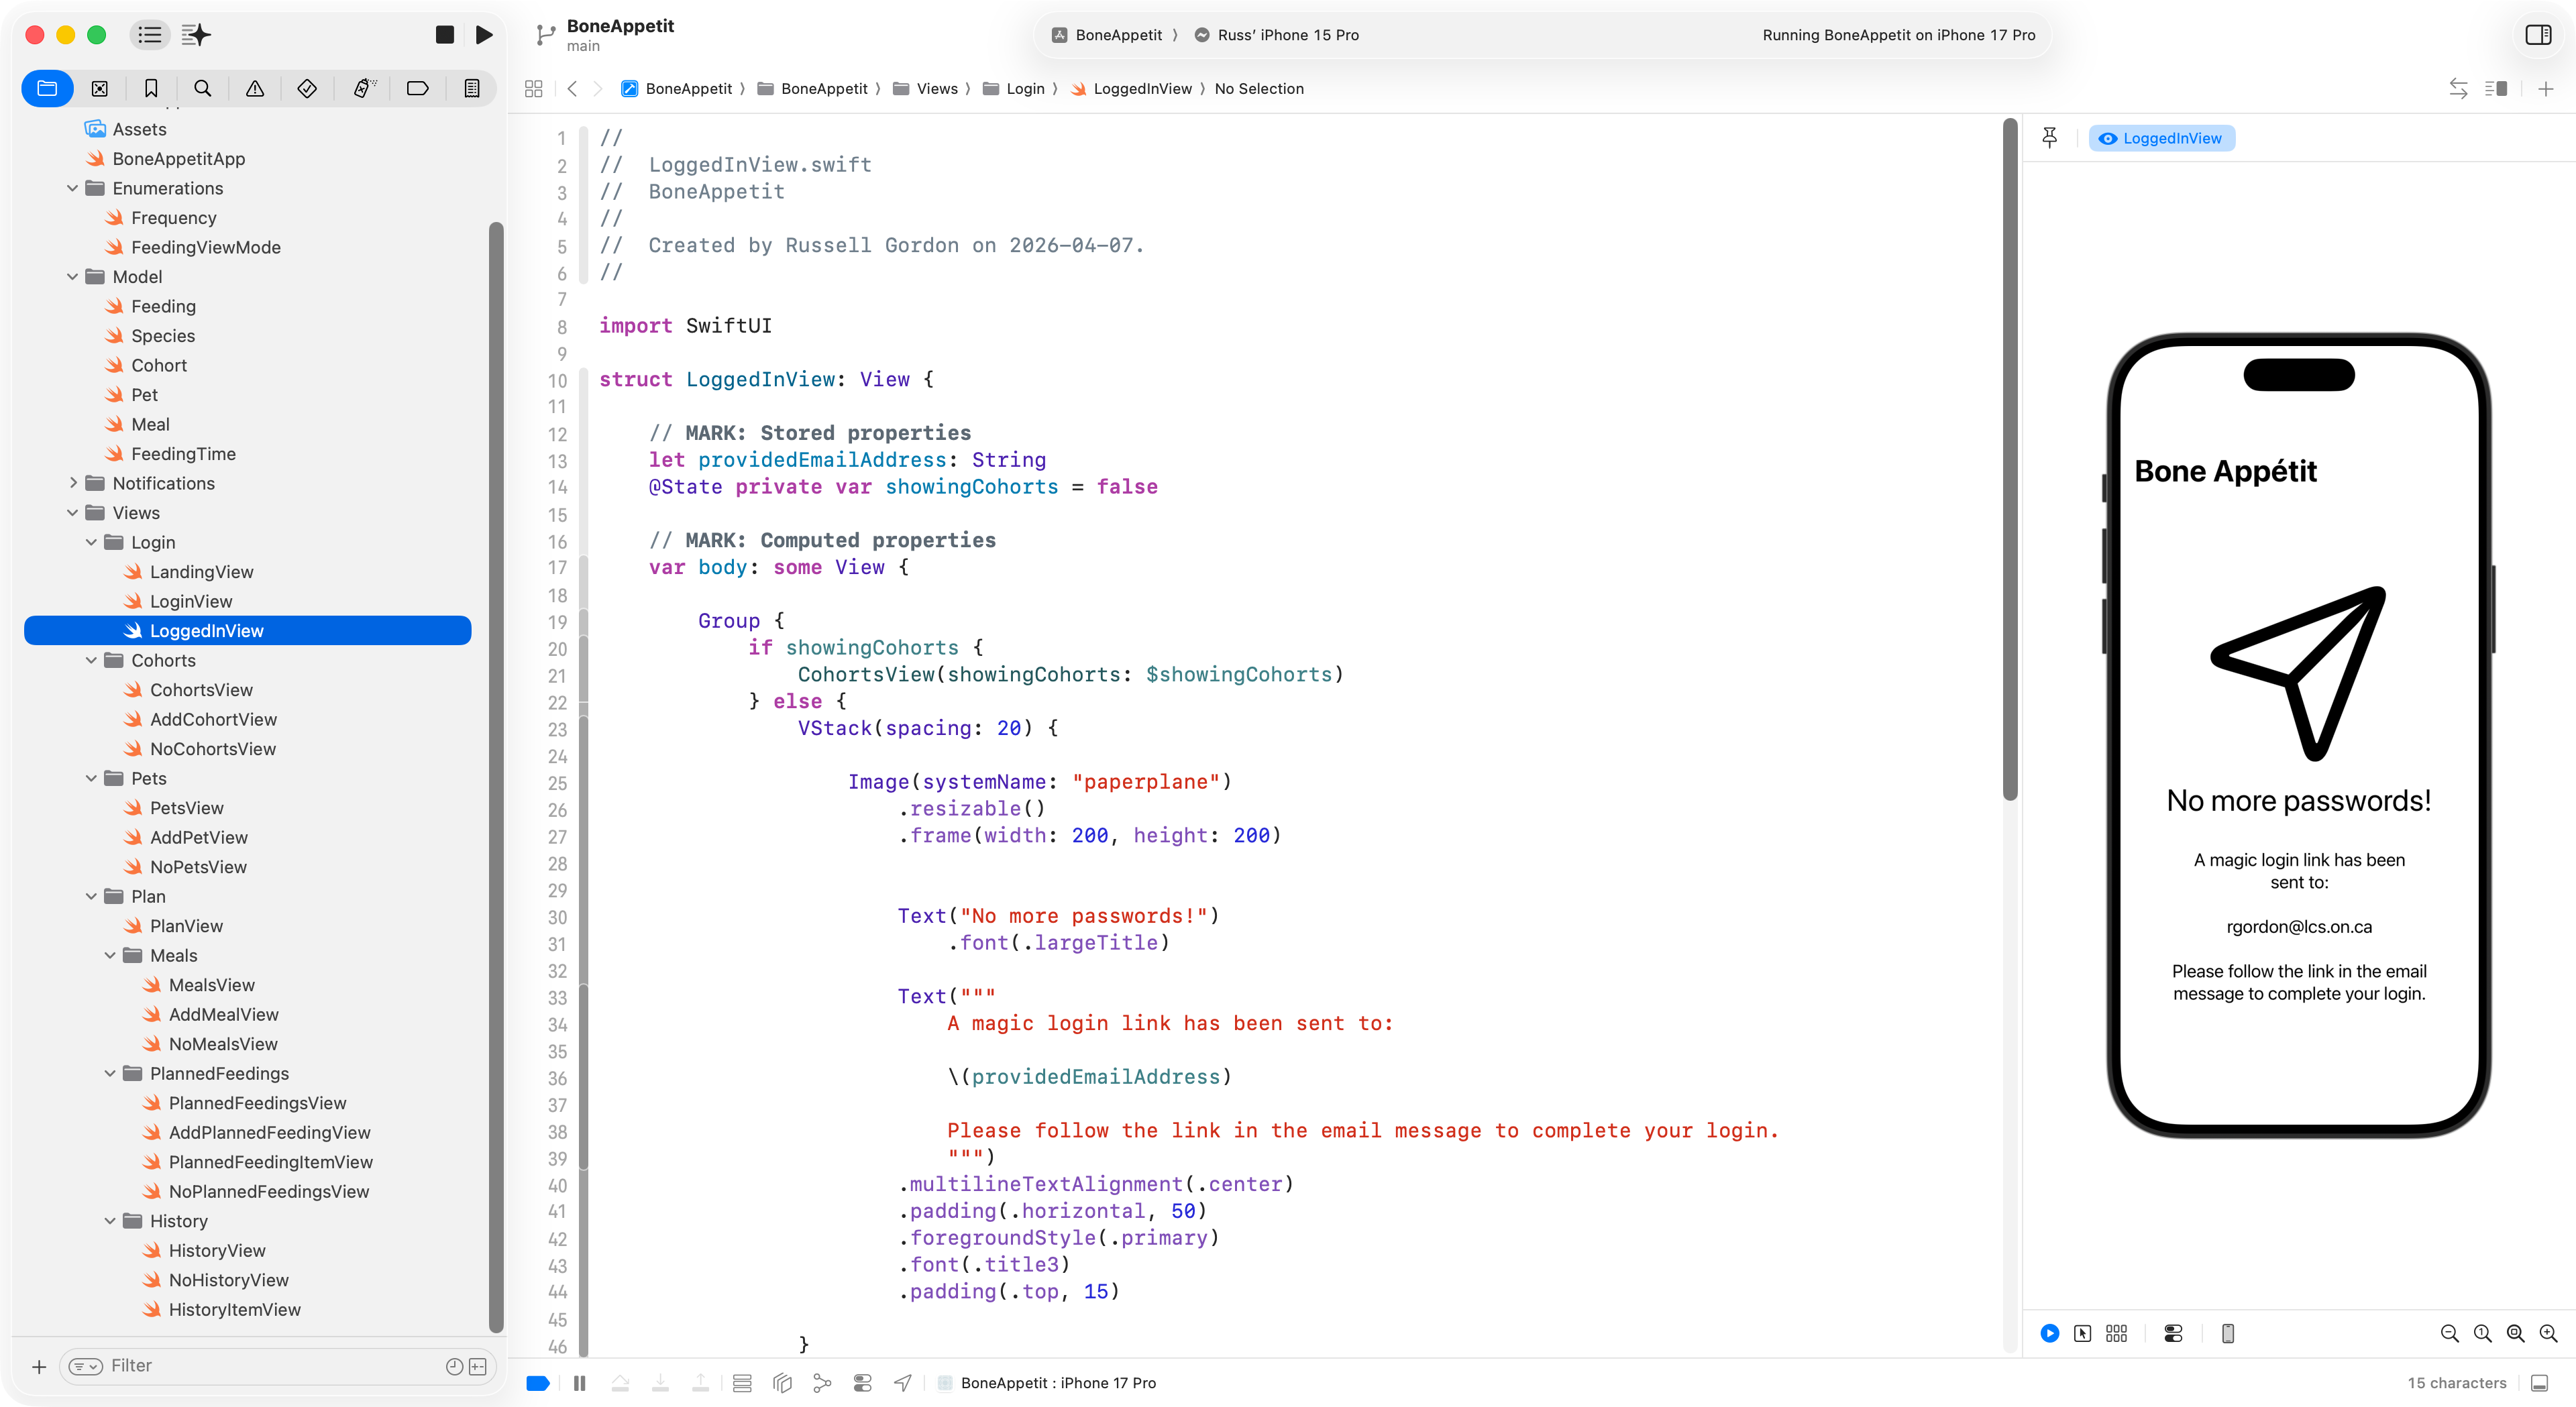
Now how the code shown adheres to the code style conventions we have discussed informally in class.
Application
From the Ontario curriculum document for Computer Studies (2009), this entails:
The use of knowledge and skills to make connections within and between various contexts:
Application of knowledge and skills in familiar contexts.
Transfer of knowledge and skills to new contexts.
Making connections within and between various contexts.
Success criteria for this portion of the task:
- to meet expectations:
- your application persists information to local storage – such as JSON-formatted text files
- you apply abstraction, by:
- using the MVVM design pattern
- to exceed expectations, you do one or both of:
- using web endpoints to obtain data that is presented in your app
- use a database to persist or share information between users of your app
Broadly speaking, this portion of the task transitions your app (or your group’s app) from a prototype to an actually functional and useful application for your intended end-users.
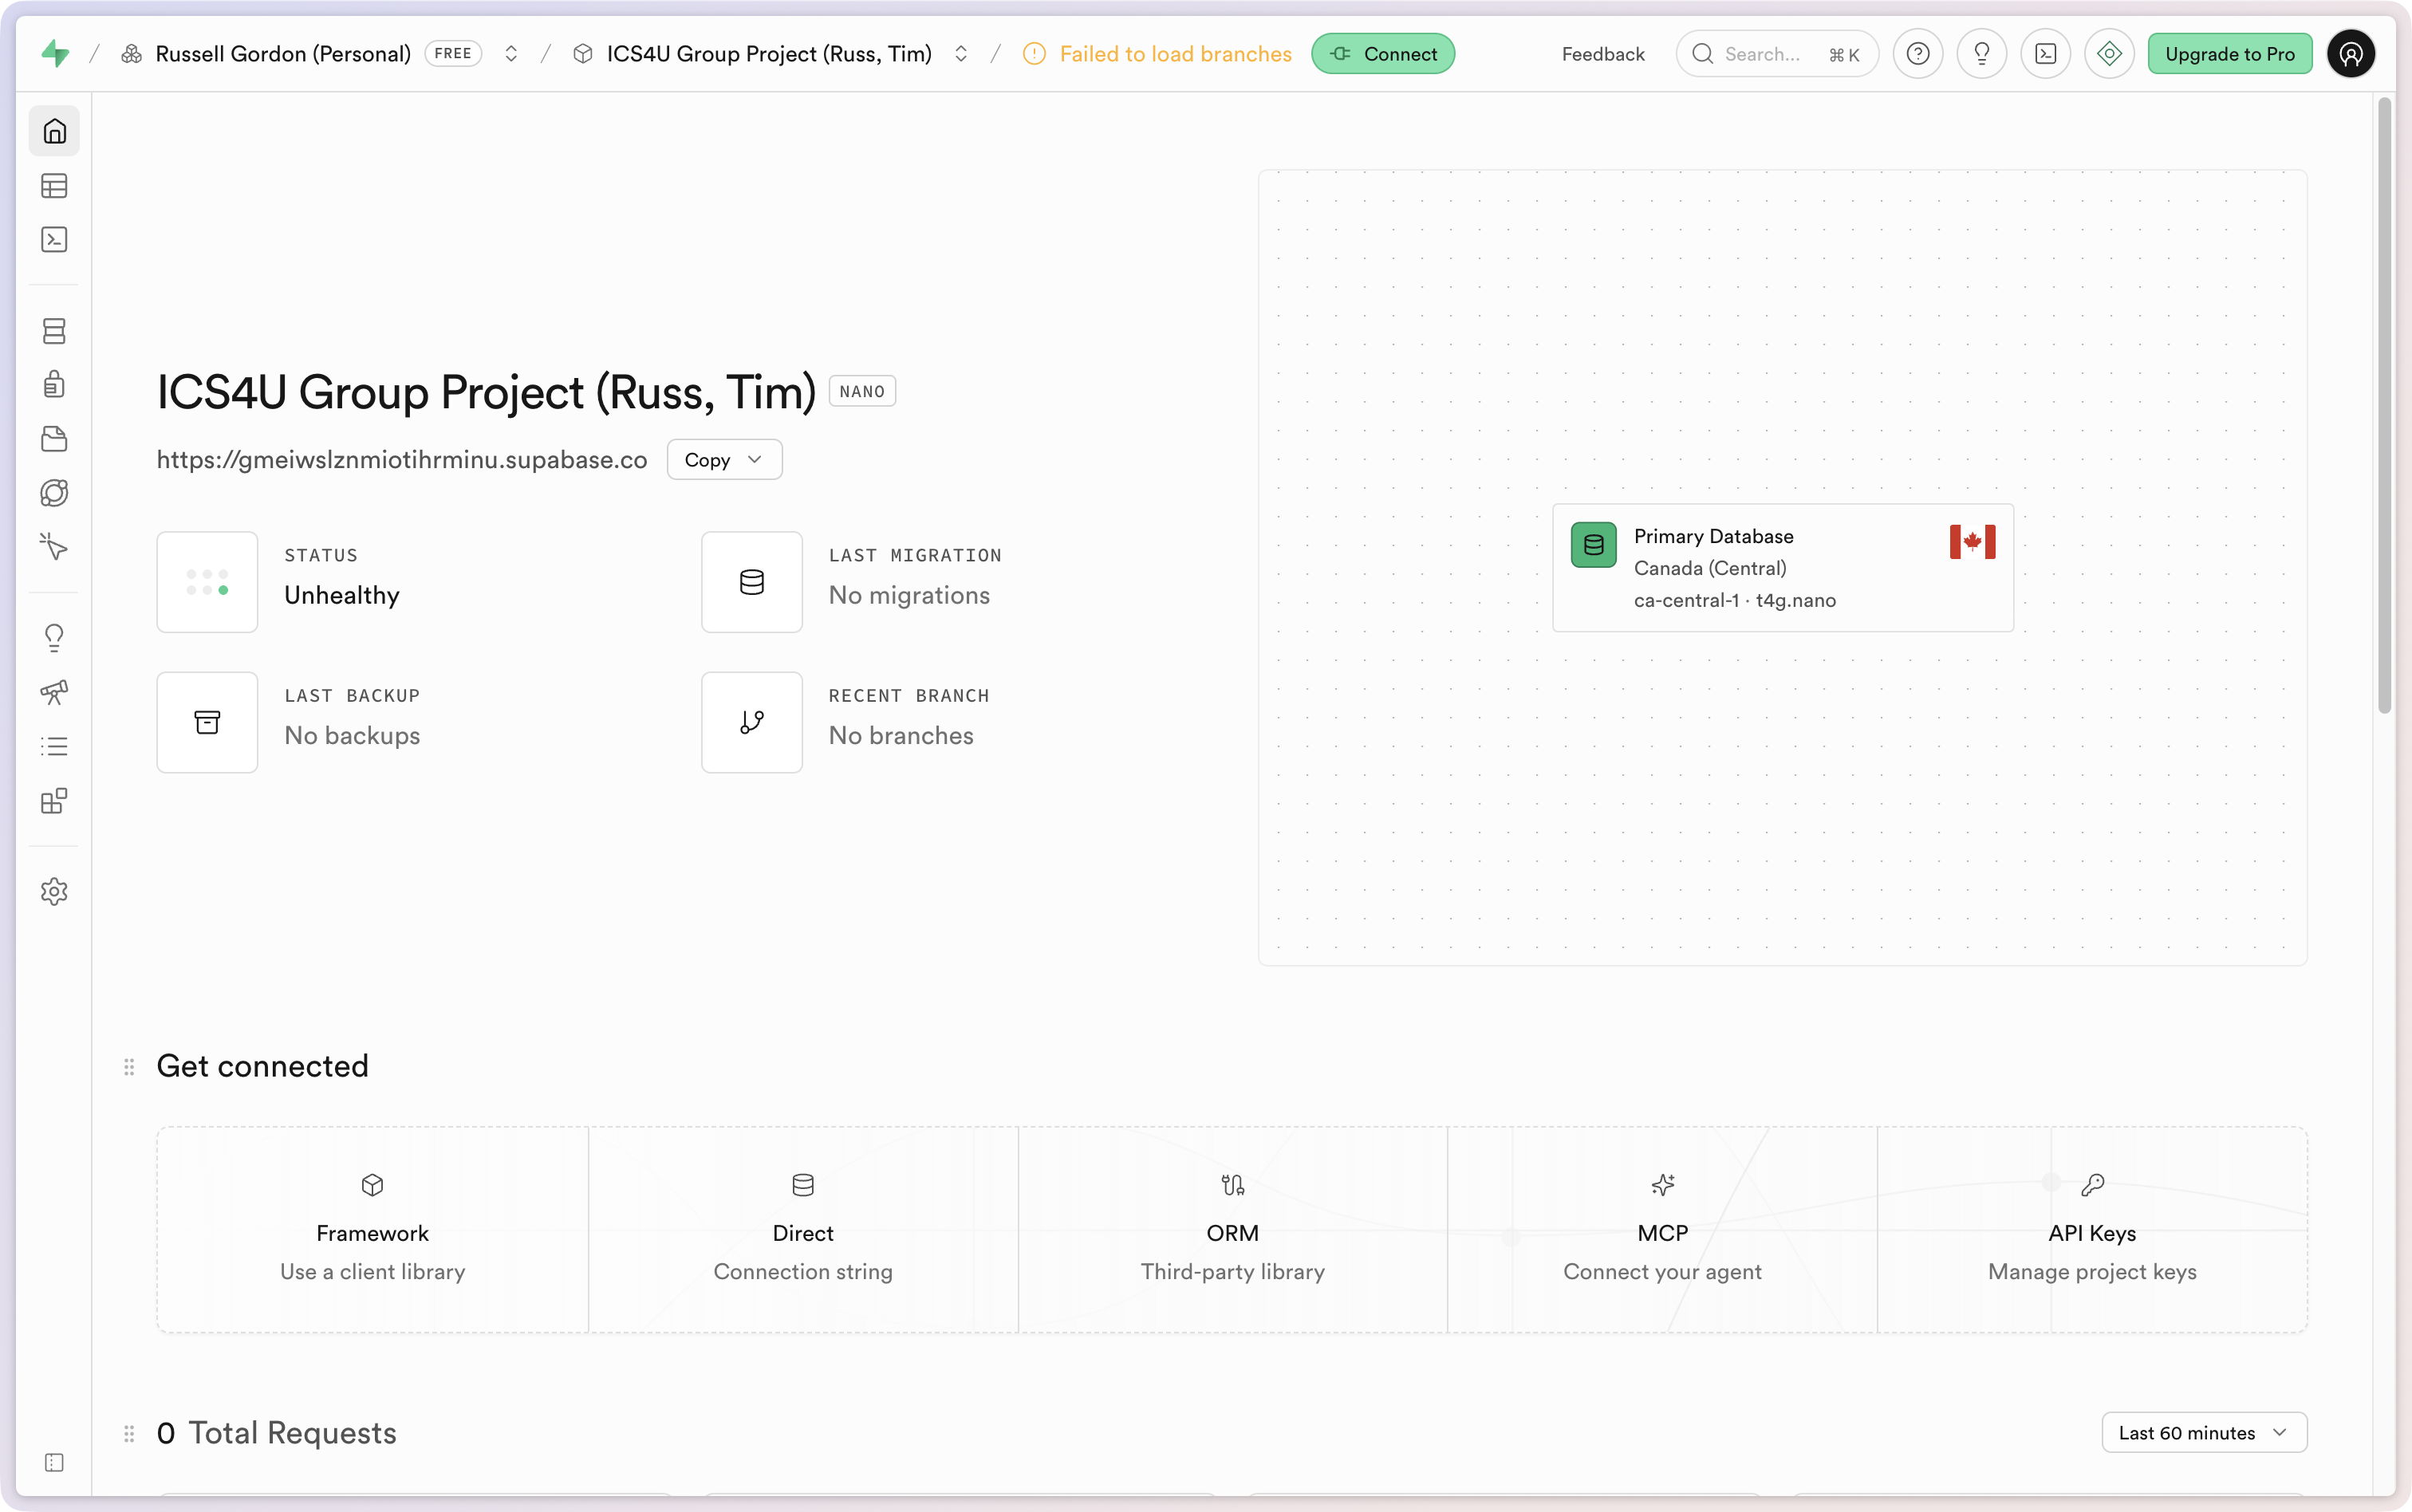
Create an organization at Supabase
At the Grade 12 level, when working within a group, we follow the steps needed to create a new Supabase organization and project:
Generate SQL from ER diagram
The next step is to have a conversation with a large language model to convert the ER diagram into SQL that can be used to create a database with sample data.
Here is the prompt used – the text shown here should be adapted depending on the context or purpose of the app in question:
I am writing an app that will be backed by a database hosted at Supabase.
The purpose of my app, Bone Appétit, is to allow groups of people who care for one or more animals to define a feeding schedule for each animal and to keep track of whether a given animal has been fed according to their defined schedule. The problem that my app solves is eliminating the need for constant co-ordination within a group of people (whether this be verbal or through a text-message stream) to figure out whether the dog, cat, or other pet, has been fed yet.
Attached is an image of a hand-drawn conceptual entity-relationship diagram. It is a Chen-style ER diagram.
Some definitions for the entities shown:
- Creature – a dog, cat, snake, or other creature kept as a pet that needs to be fed on a regular basis by humans.
- Cohort – a group of people who care for a creature.
- Person - a person who will be a member of a cohort.
- Meal – the food type (kibble, treat, et cetera) and quantity that will be fed to a creature on a regular basis.
- Planned Feeding – a point in time when a meal will be fed to a creature.
- Frequency – the frequency with which a planned feeding occurs – for example, a time unit of 7 with a frequency of “daily” means a feeding is planned for 7 AM. A time unit of 3 with a frequency of “annually” means the feeding will occur sometime during the month of March – this might be a monthly “treat meal” for example.
- Species – What type of creature is being cared for (e.g.: Dog, cat, snake, rabbit).
- Feeding Event – A planned feeding is used to trigger the creation of feeding events based on the planned feeding’s time unit and frequency; a person will at some point carry out (complete) the feeding event.
Please convert ER diagram image into valid SQL that will create database tables with columns, primary keys, and foreign keys where appropriate based on the cardinality described in the diagram.
Any columns that will contain text data should have a datatype of “text”. Any columns that contain integer data should have a datatype of “int8”. Any columns that will contain a date or time should have a datatype of “timestamptz”.
Otherwise, do your best to infer data types for table columns based on the name of attributes given for each entity.
Please ensure that primary key columns are defined as an identity so that the database will automatically assign a sequential unique number to the column when a new row is added to a table.
For tables that will facilitate a many-to-many relationship, please also add a separate “id” column as a unique identifier / identity / primary key.
Be certain that the SQL you generate is compatible with the PostgreSQL database software (the database will be hosted at Supabase).
Table and column names should always be lowercase. Use snake_case to represent table and column names with multiple words.
Note that dotted lines leading from an entity to an attribute denote an attribute that can hold a null or optional value.
After generating the SQL required to create the database, could you also please create some reasonable sample data?
Please include sample data with these requirements:
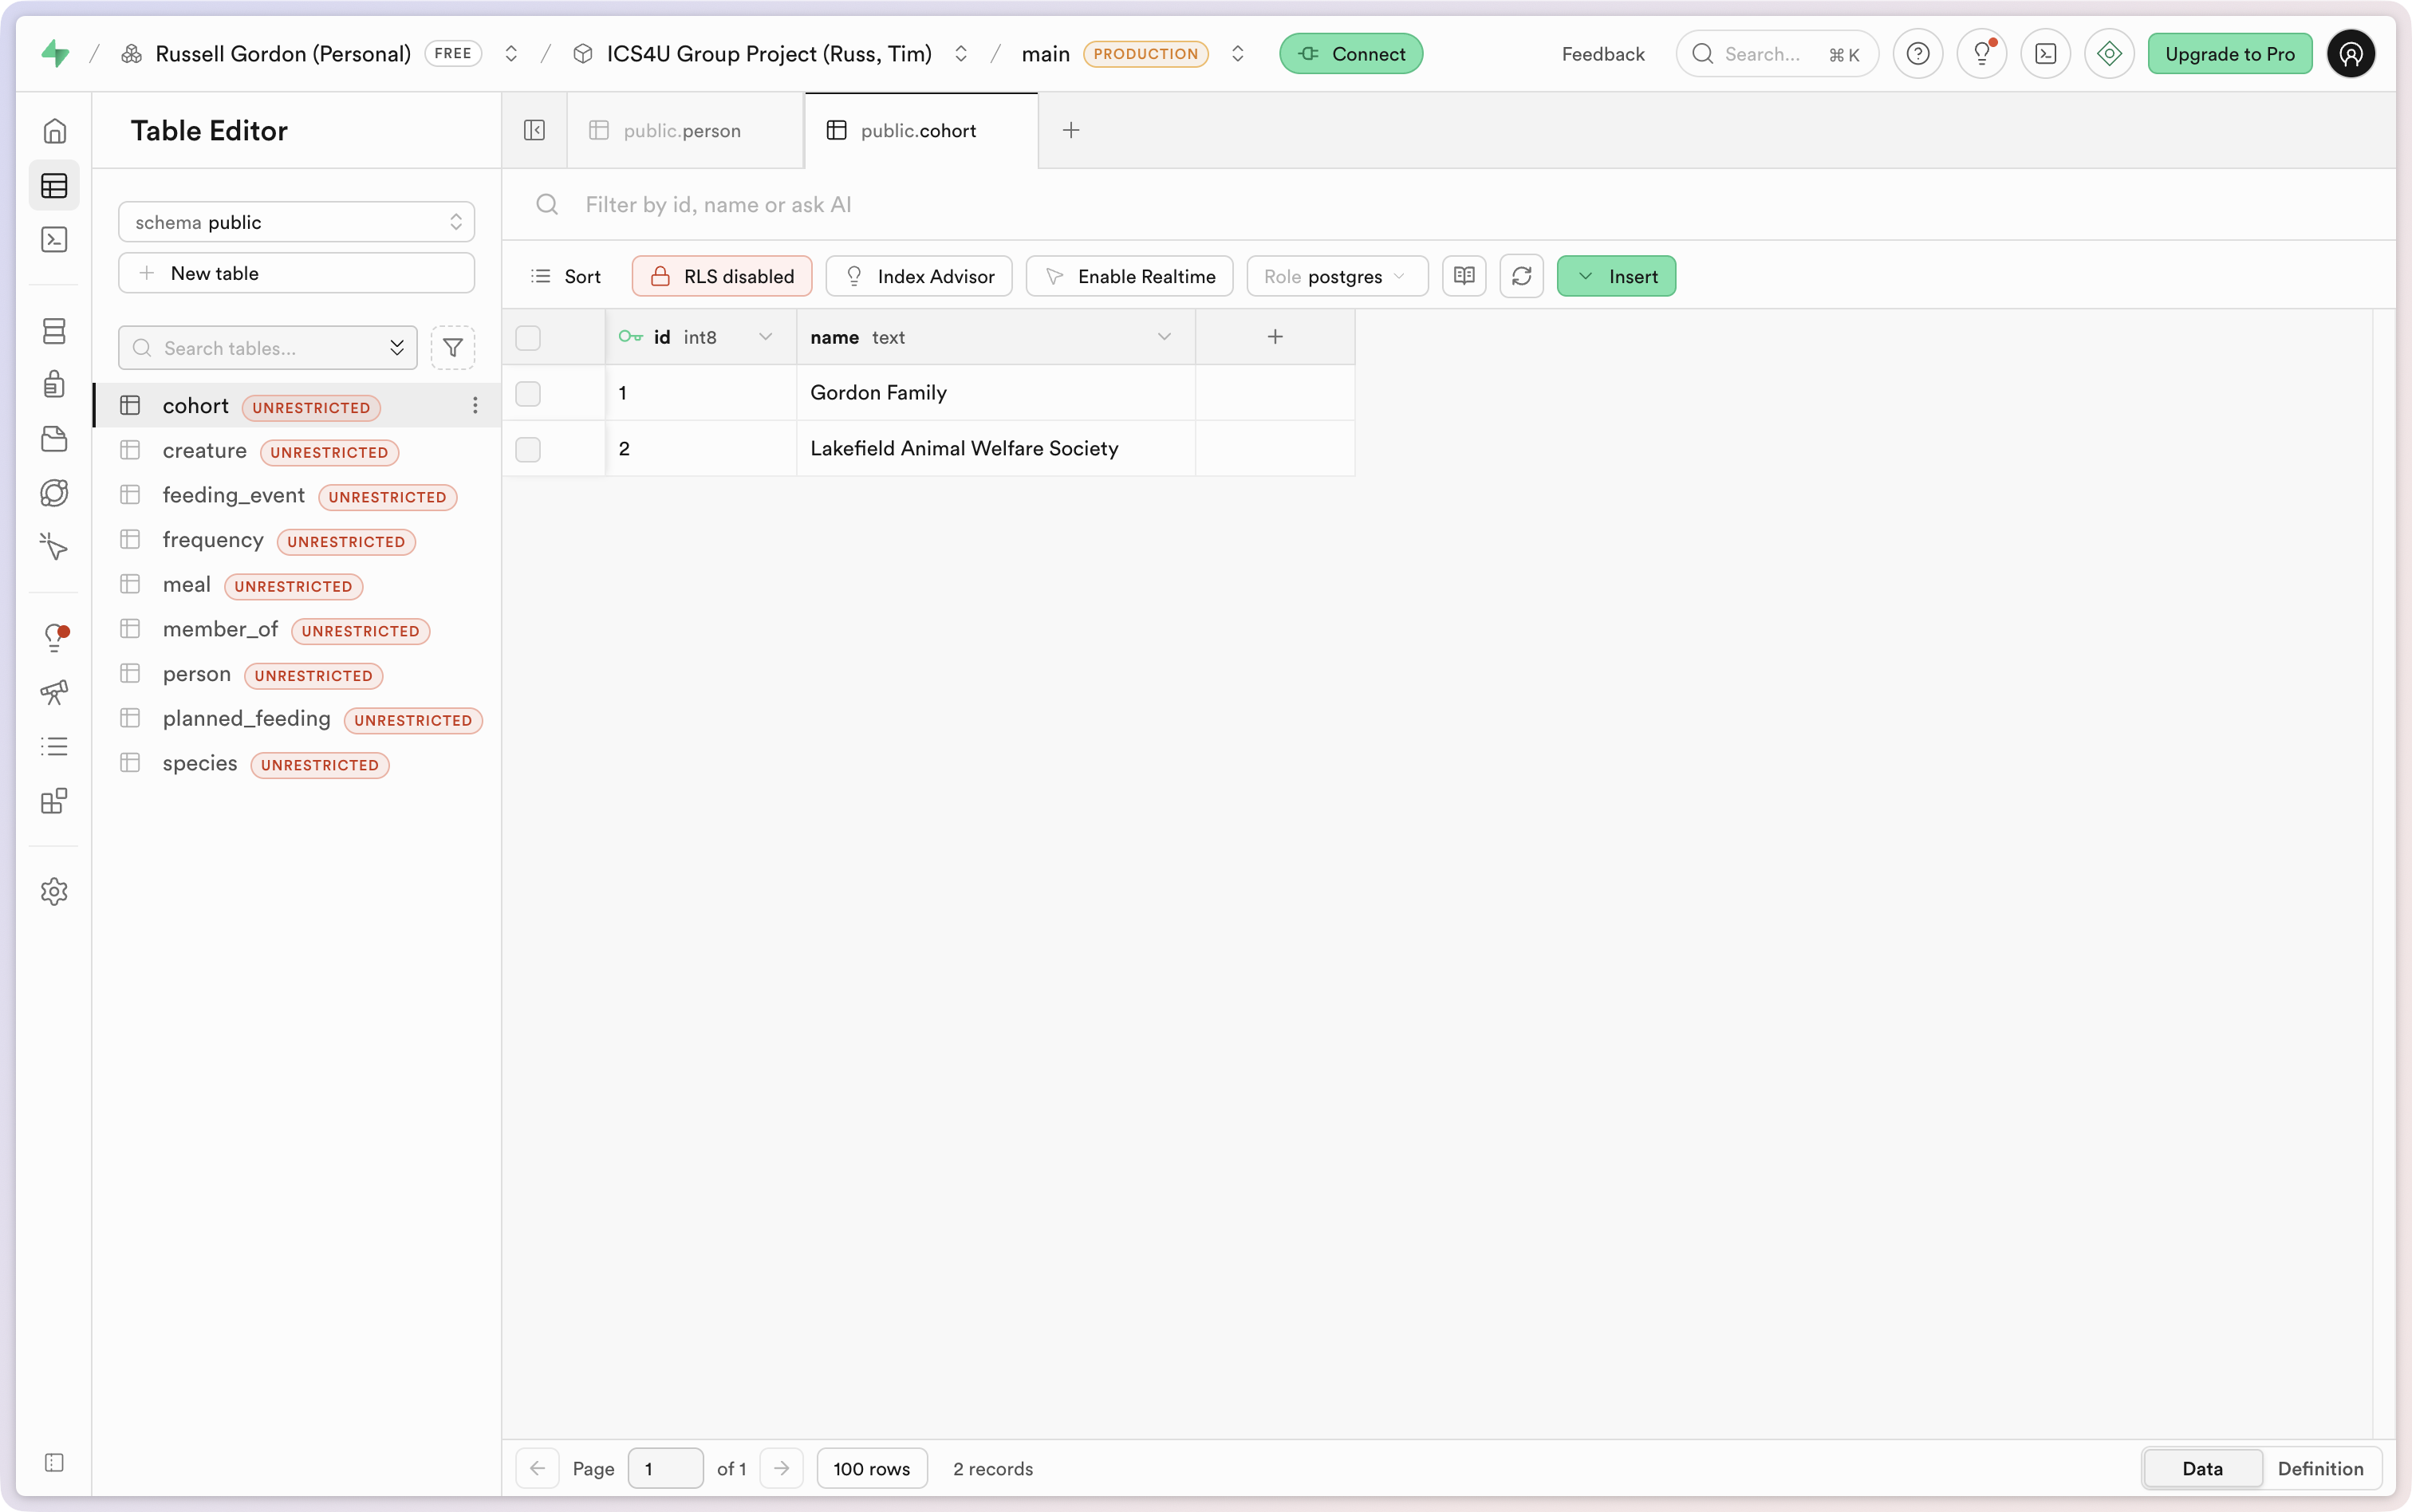
- at least two cohorts (let’s say “Gordon Family” and “Lakefield Animal Welfare Society”)
- at least 10 persons
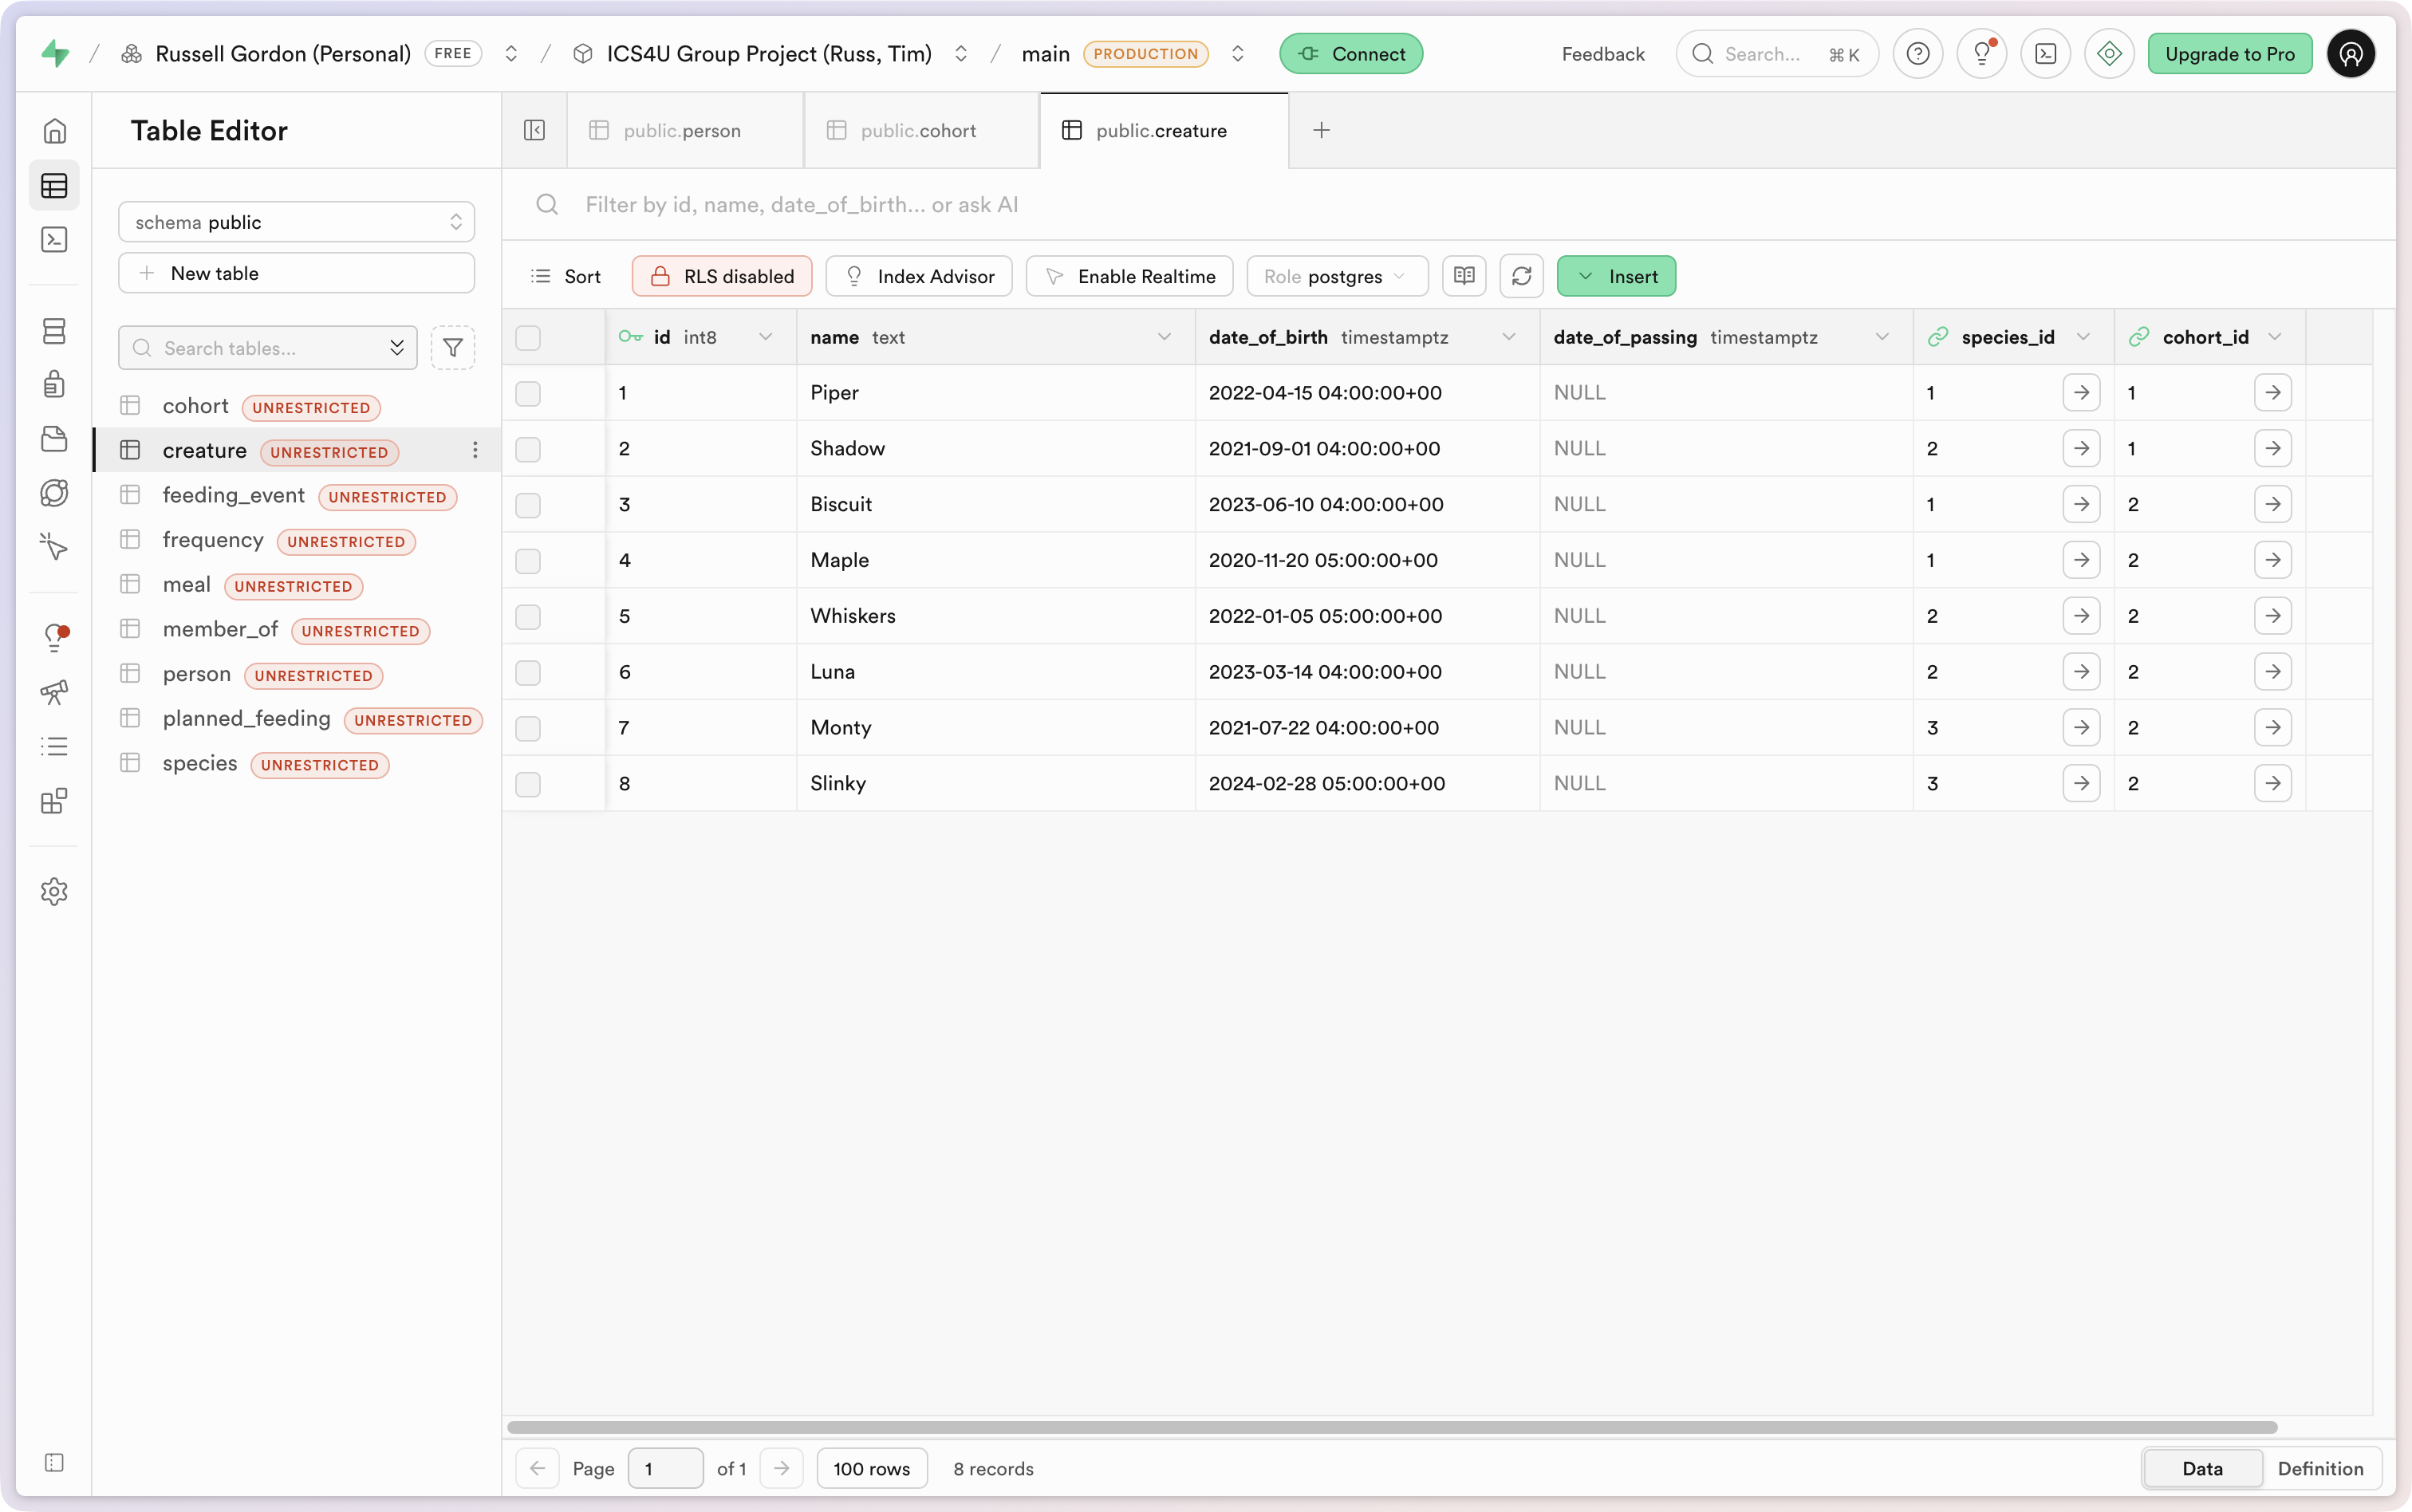
- at least 8 creatures (some dogs, cats, and snakes)
- “Gordon Family” should have a dog named Piper and a cat named Shadow
- “Gordon Family” should be composed of three people named “Russ”, “Jen”, and “Claire”
- Piper should have two meals (1.5 scoops of kibble, 1 cup of Puppucino)
- Piper should have a four daily planned feedings of the kibble meal, at 7 AM, 11 AM, 3 PM, and 7 PM and one annual planned feeding of the Puppucino meal in August
- Frequency options must include hourly (id of 1), daily (id of 2), biweekly (id of 3), weekly (id of 4), monthly (id of 5), and annually (id of 6)
Thank-you in advance for all of your effort!
NOTE
It’s entirely normal that you might realize a change to your ER diagram is required.
In the process of authoring this prompt for the large language model, the author realized there were changes required to his entity-relationship diagram.
Here is a revised diagram – it is this diagram that is referred to in the prompt above:
Here is the SQL file that was produced.
Claude provided the following notes:
A few notes on design decisions:
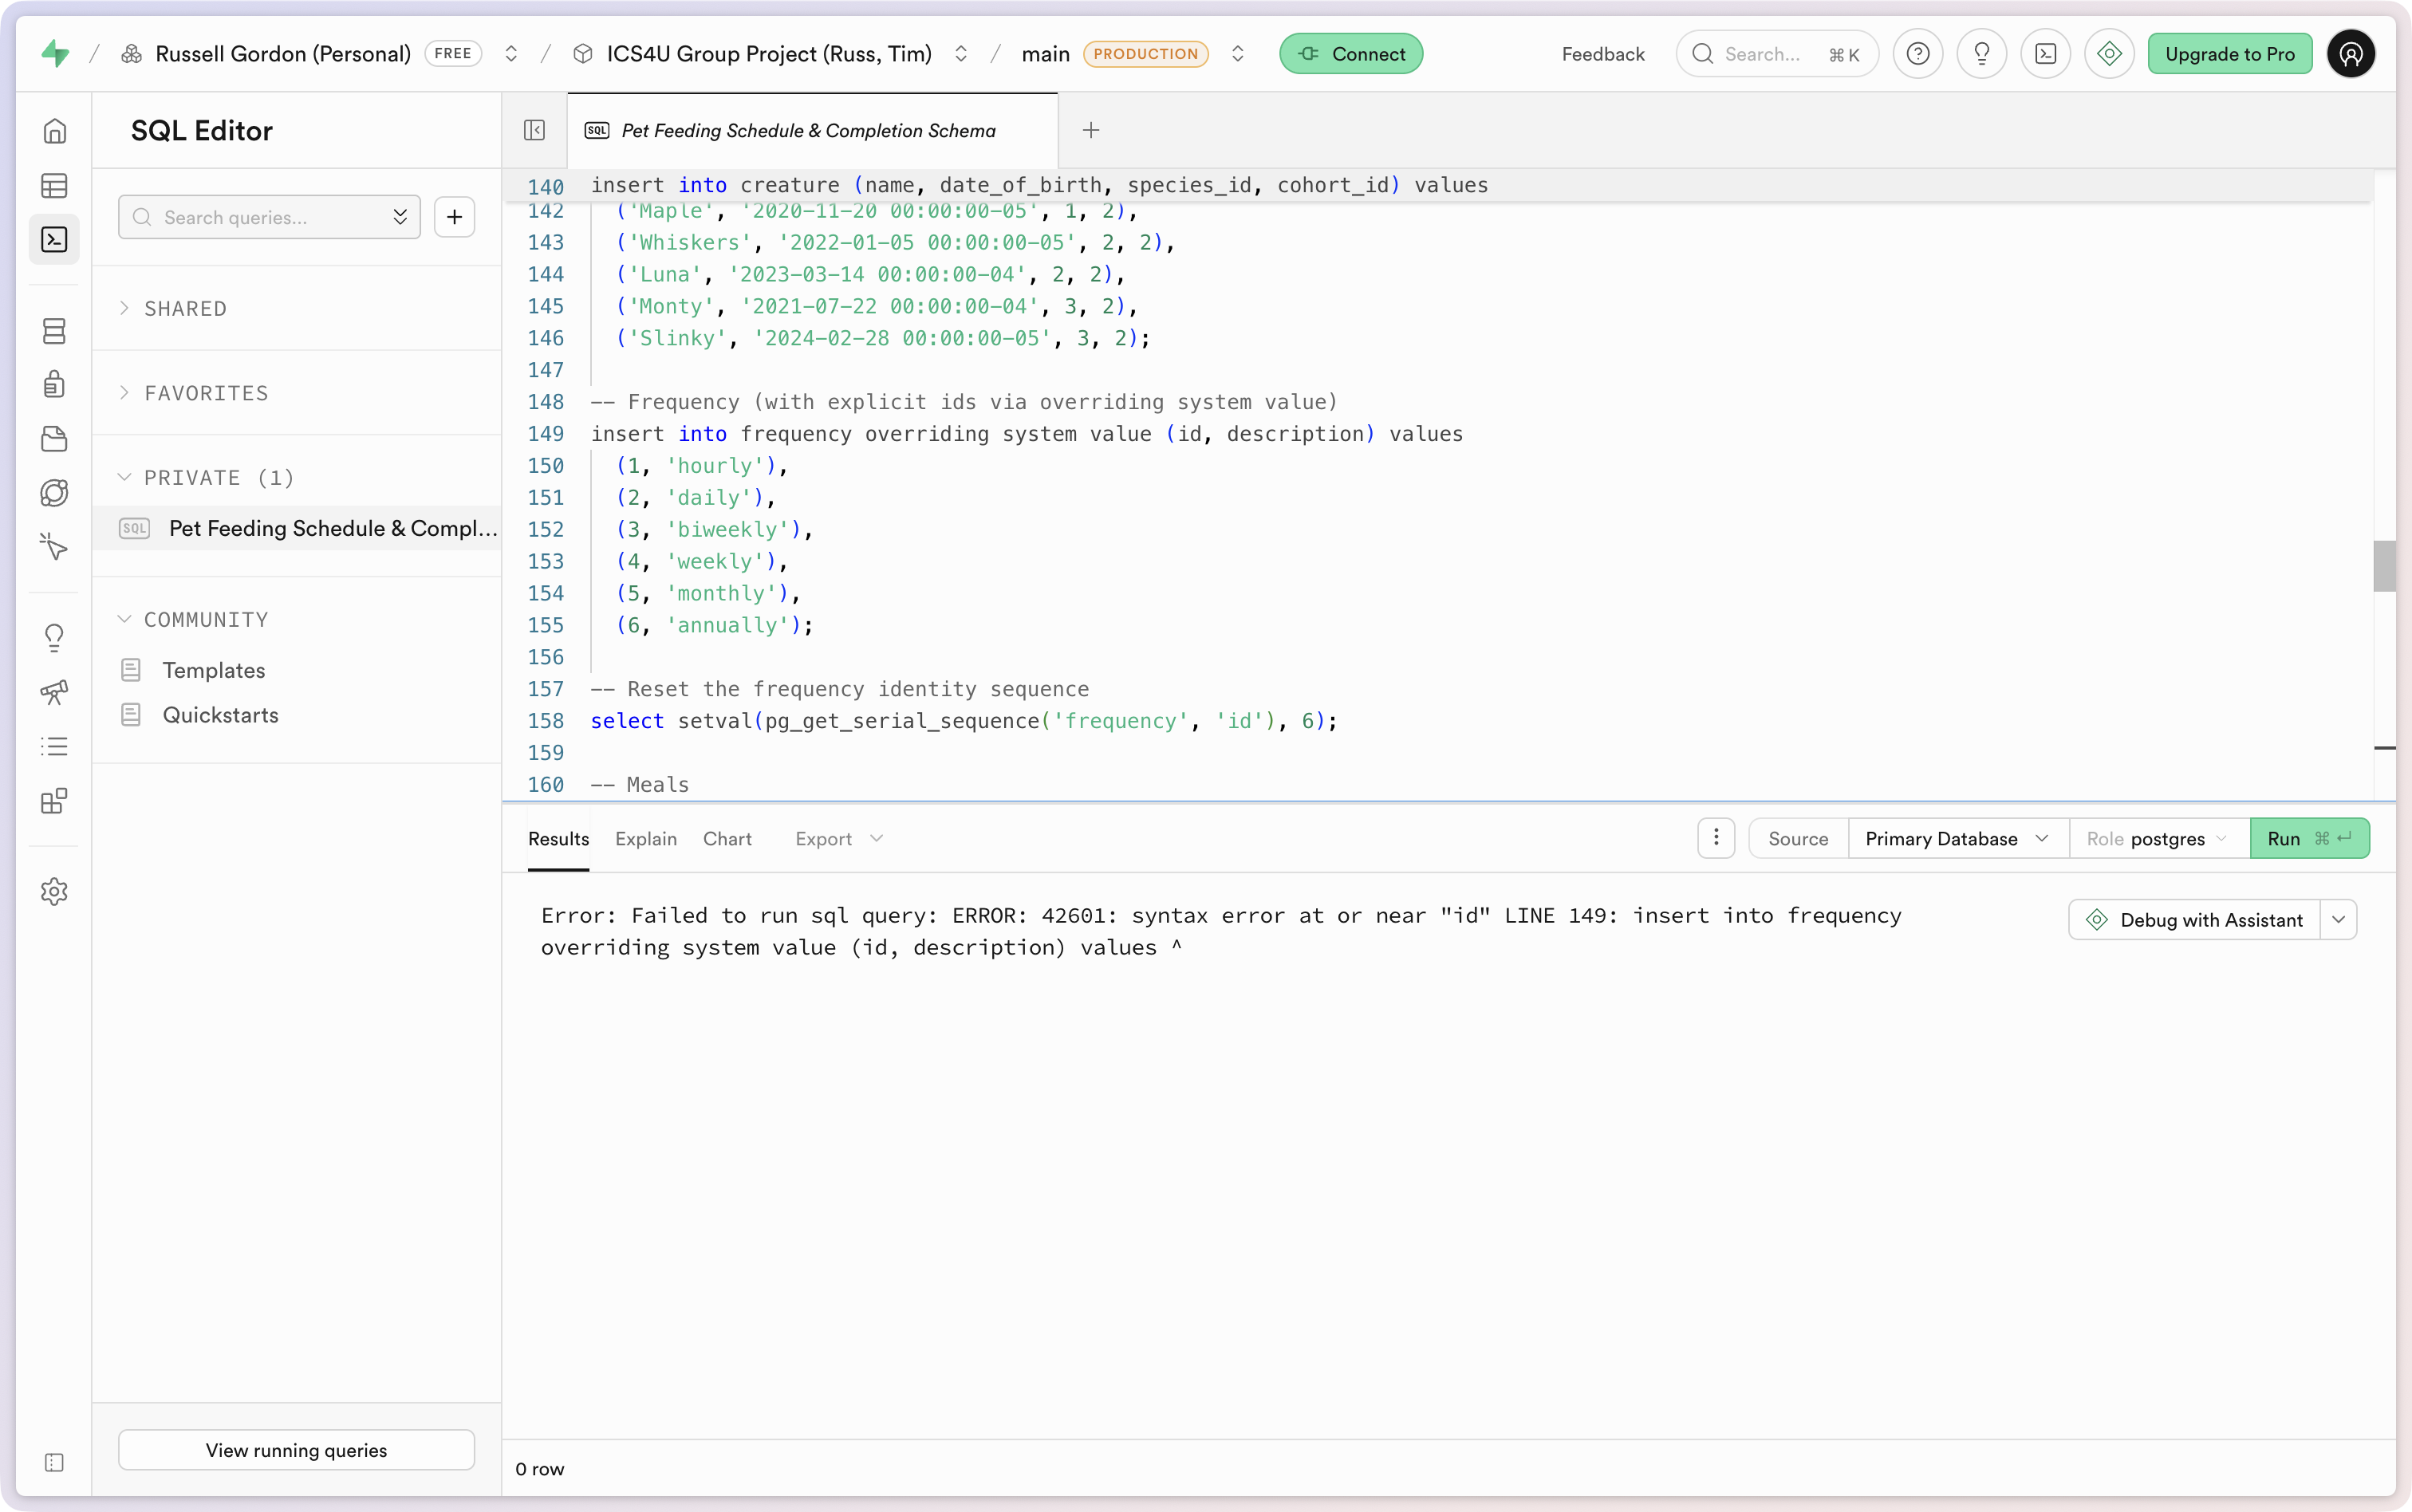
member_ofis the join table for the many-to-many betweenpersonandcohort, with the relationship attributes (date_invited,date_left,is_membership_accepted,is_membership_paused,administers) living on that table.creaturehas a foreign key to bothspeciesandcohort.date_of_passingis nullable per the dotted line.mealbelongs to acreatureand has aquantitycolumn typed asnumericto support values like 1.5.planned_feedinglinks amealto afrequency, withtime_unitasint8representing thehour(for daily) ormonth(for annually), etc.feeding_eventreferences both aplanned_feedingand optionally apersonwho completed it.actually_carried_out_at_time_and_dateisnulluntil someone marks it done.- Frequency rows are inserted with explicit IDs using overriding system value, followed by a setval to keep the sequence in sync.
- Sample data includes yesterday’s feeding events for Piper all completed by the Gordon family, and today’s events still pending.
Create the database
Next, we use the SQL to build the database.
This can sometimes result in an error:
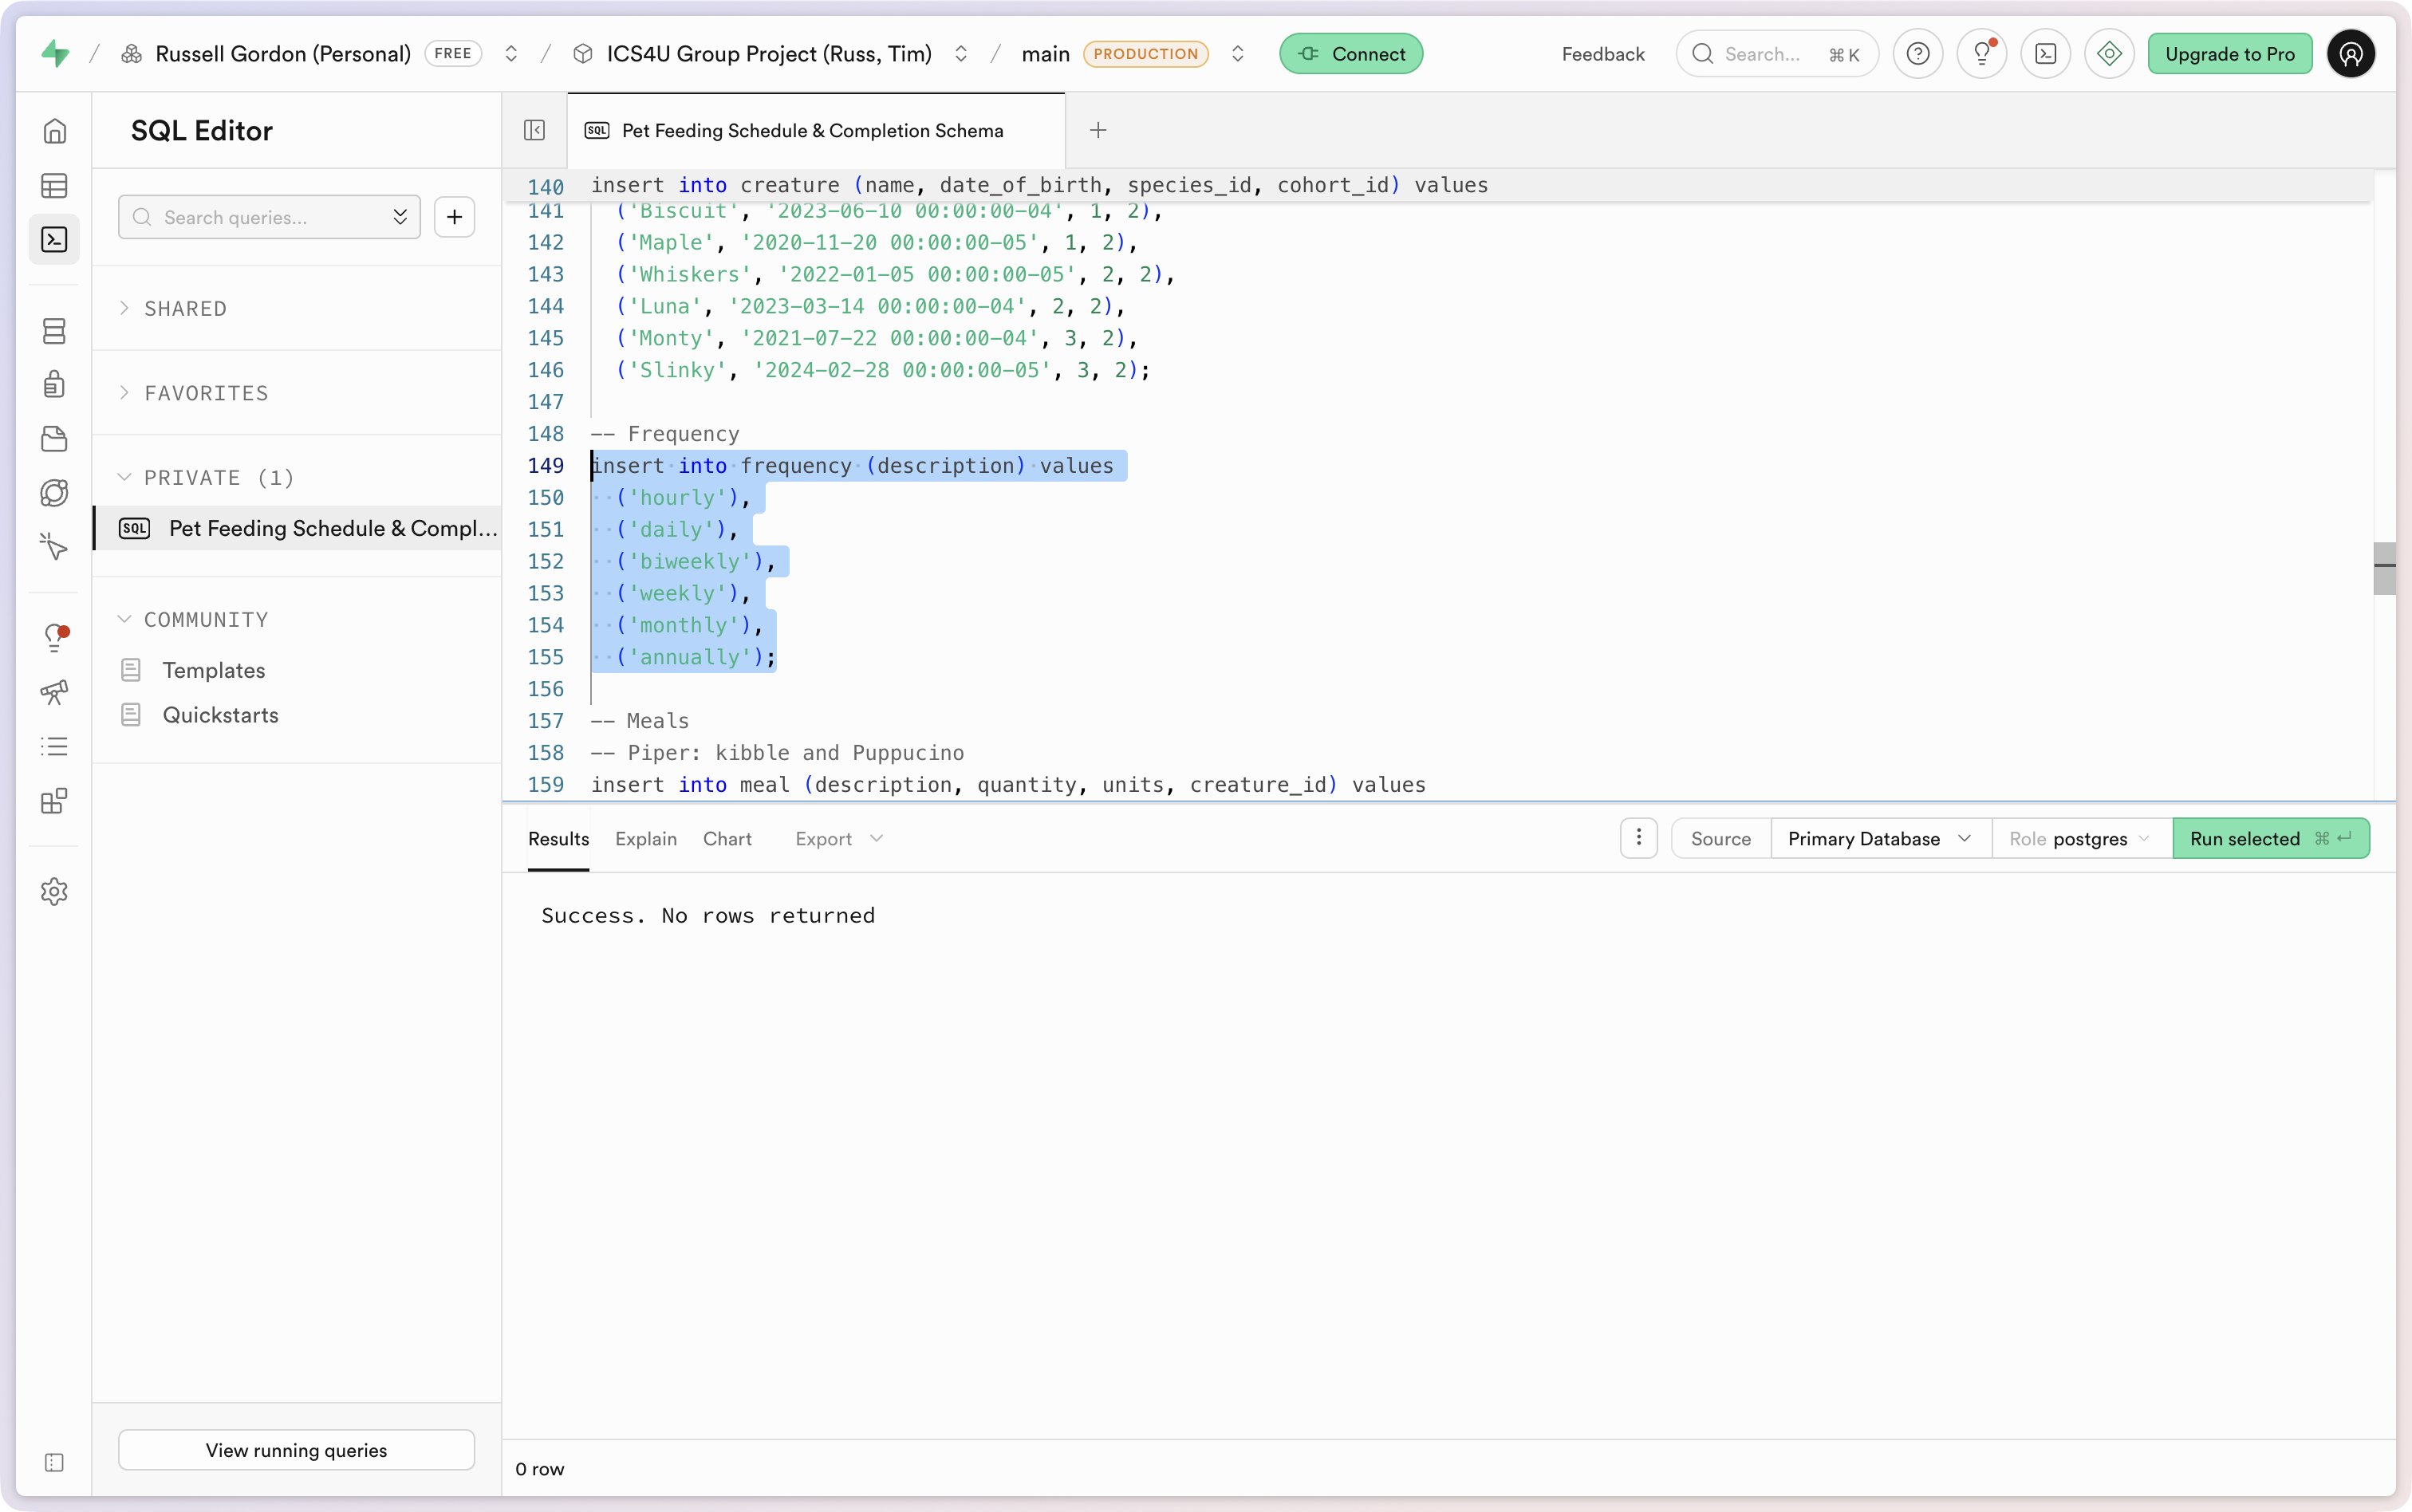
With a quick edit to correct the problem, the SQL could then be run to create the database:
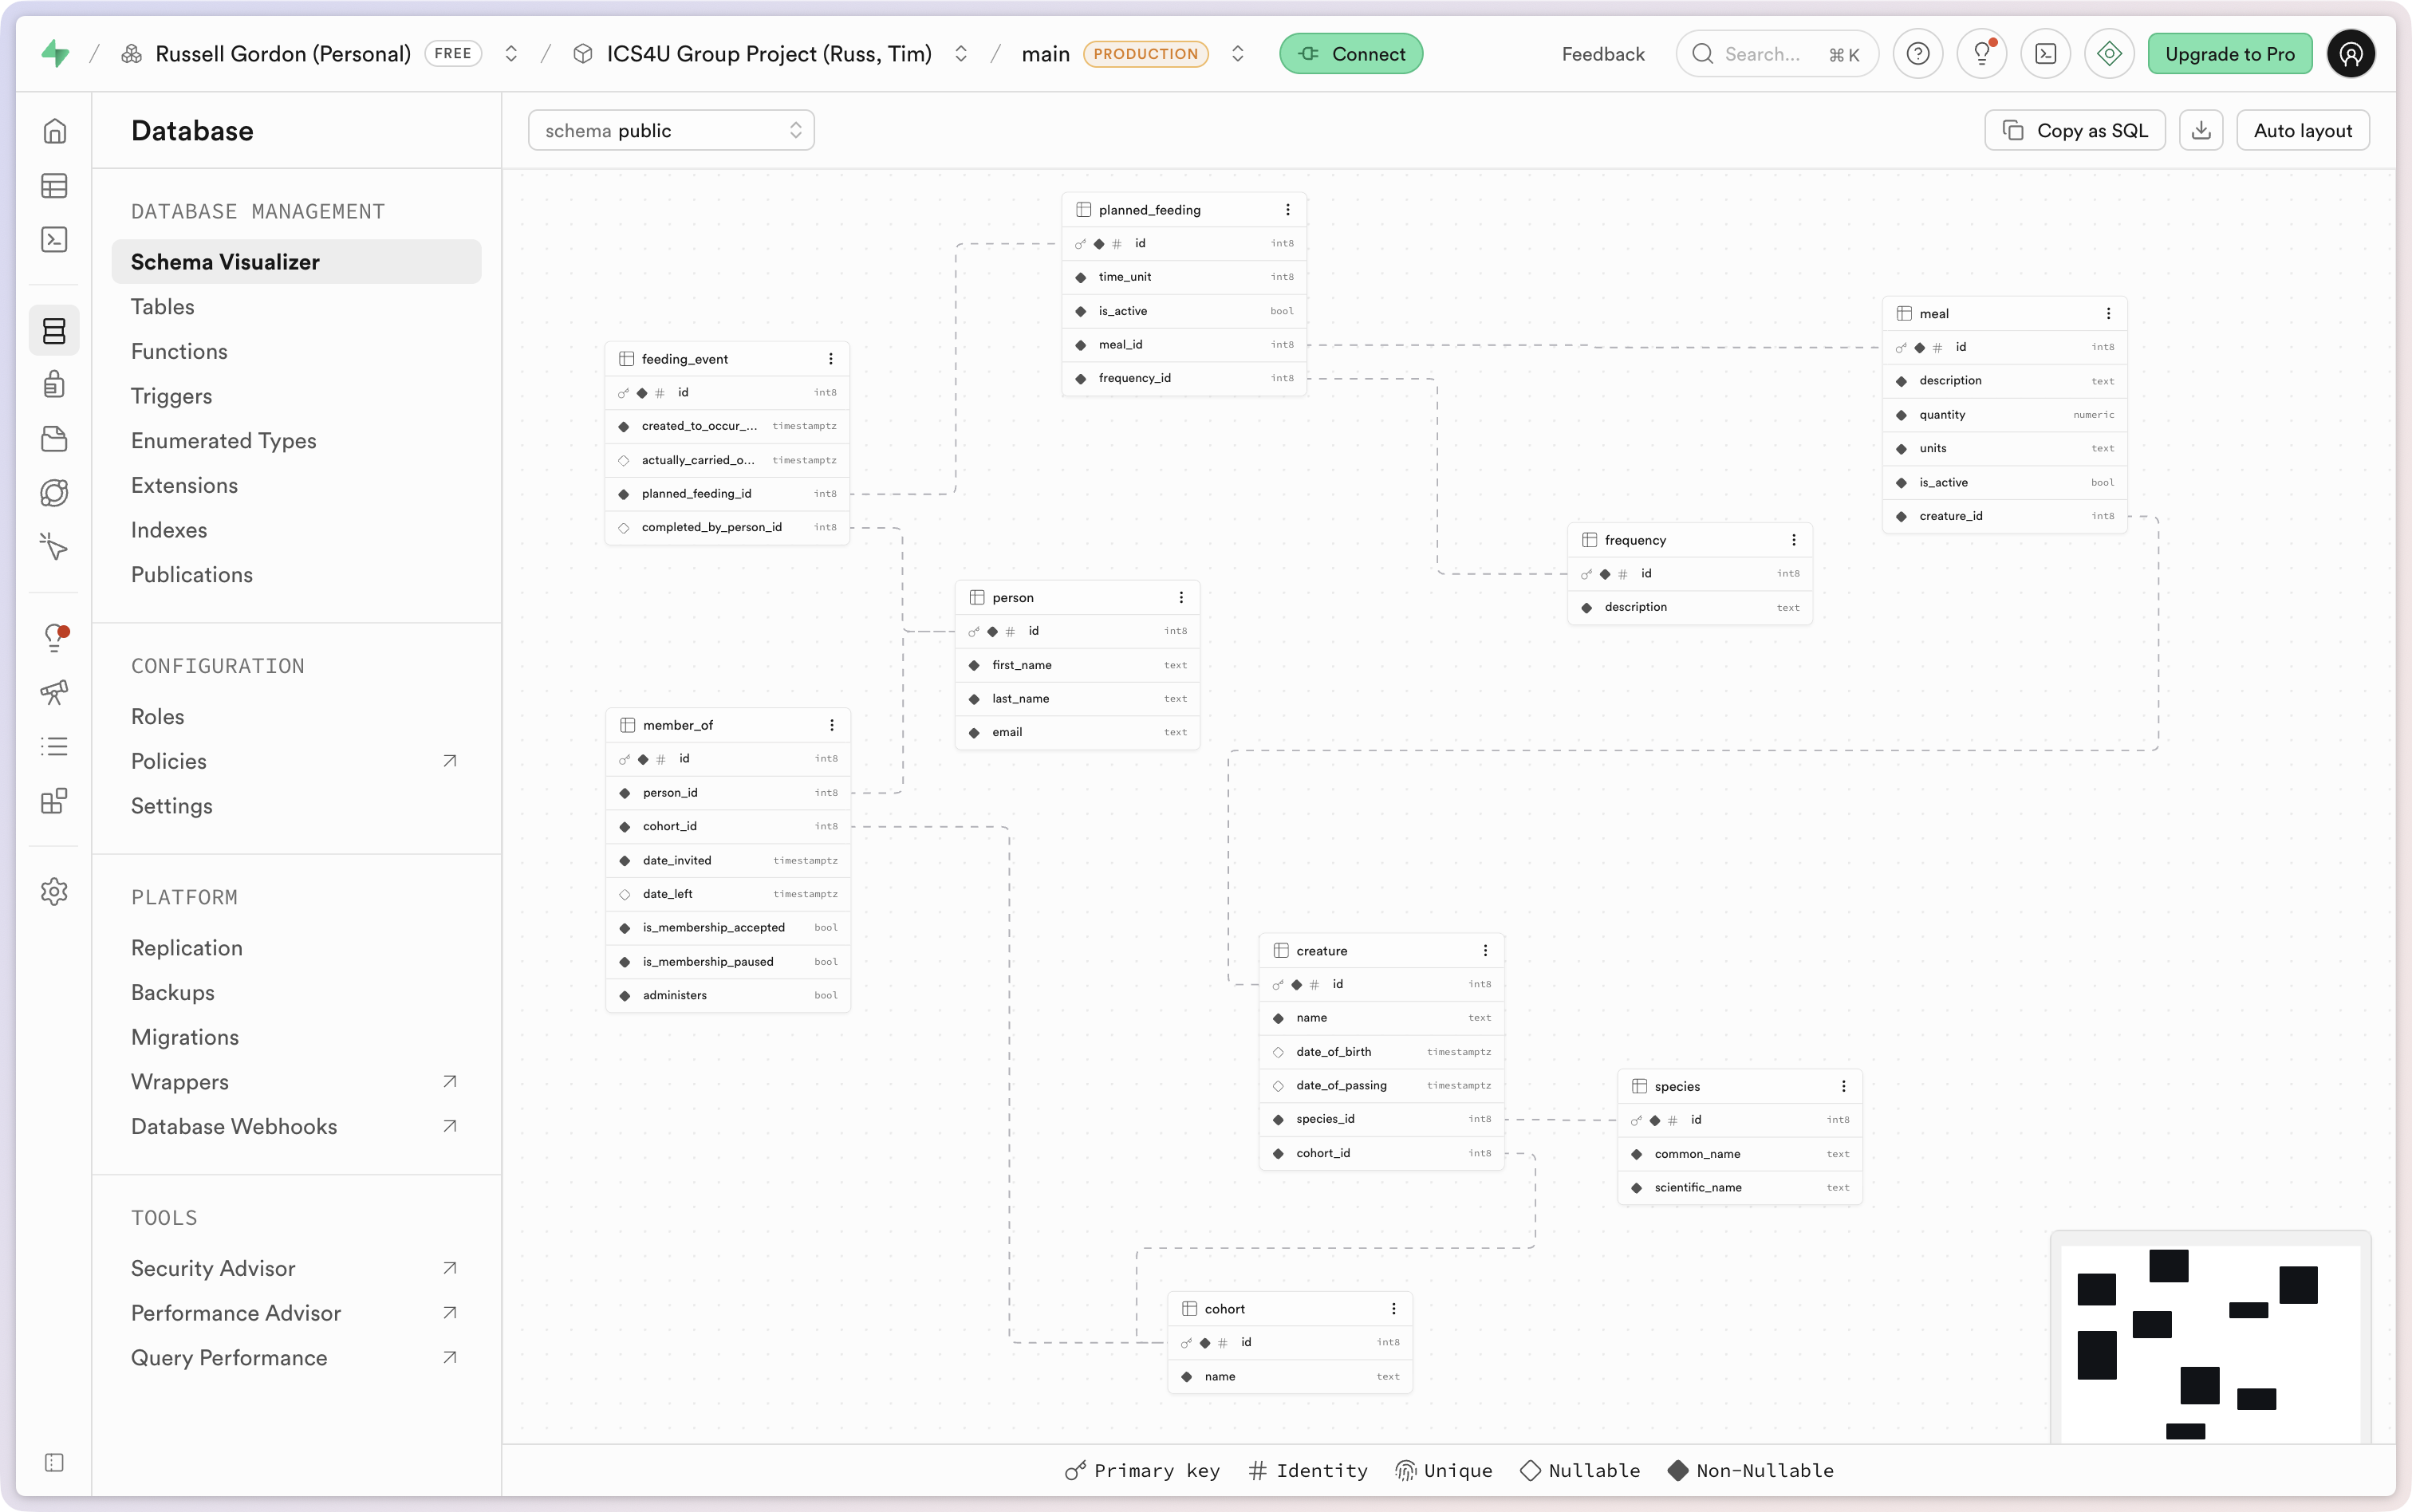
This is the resulting database layout:
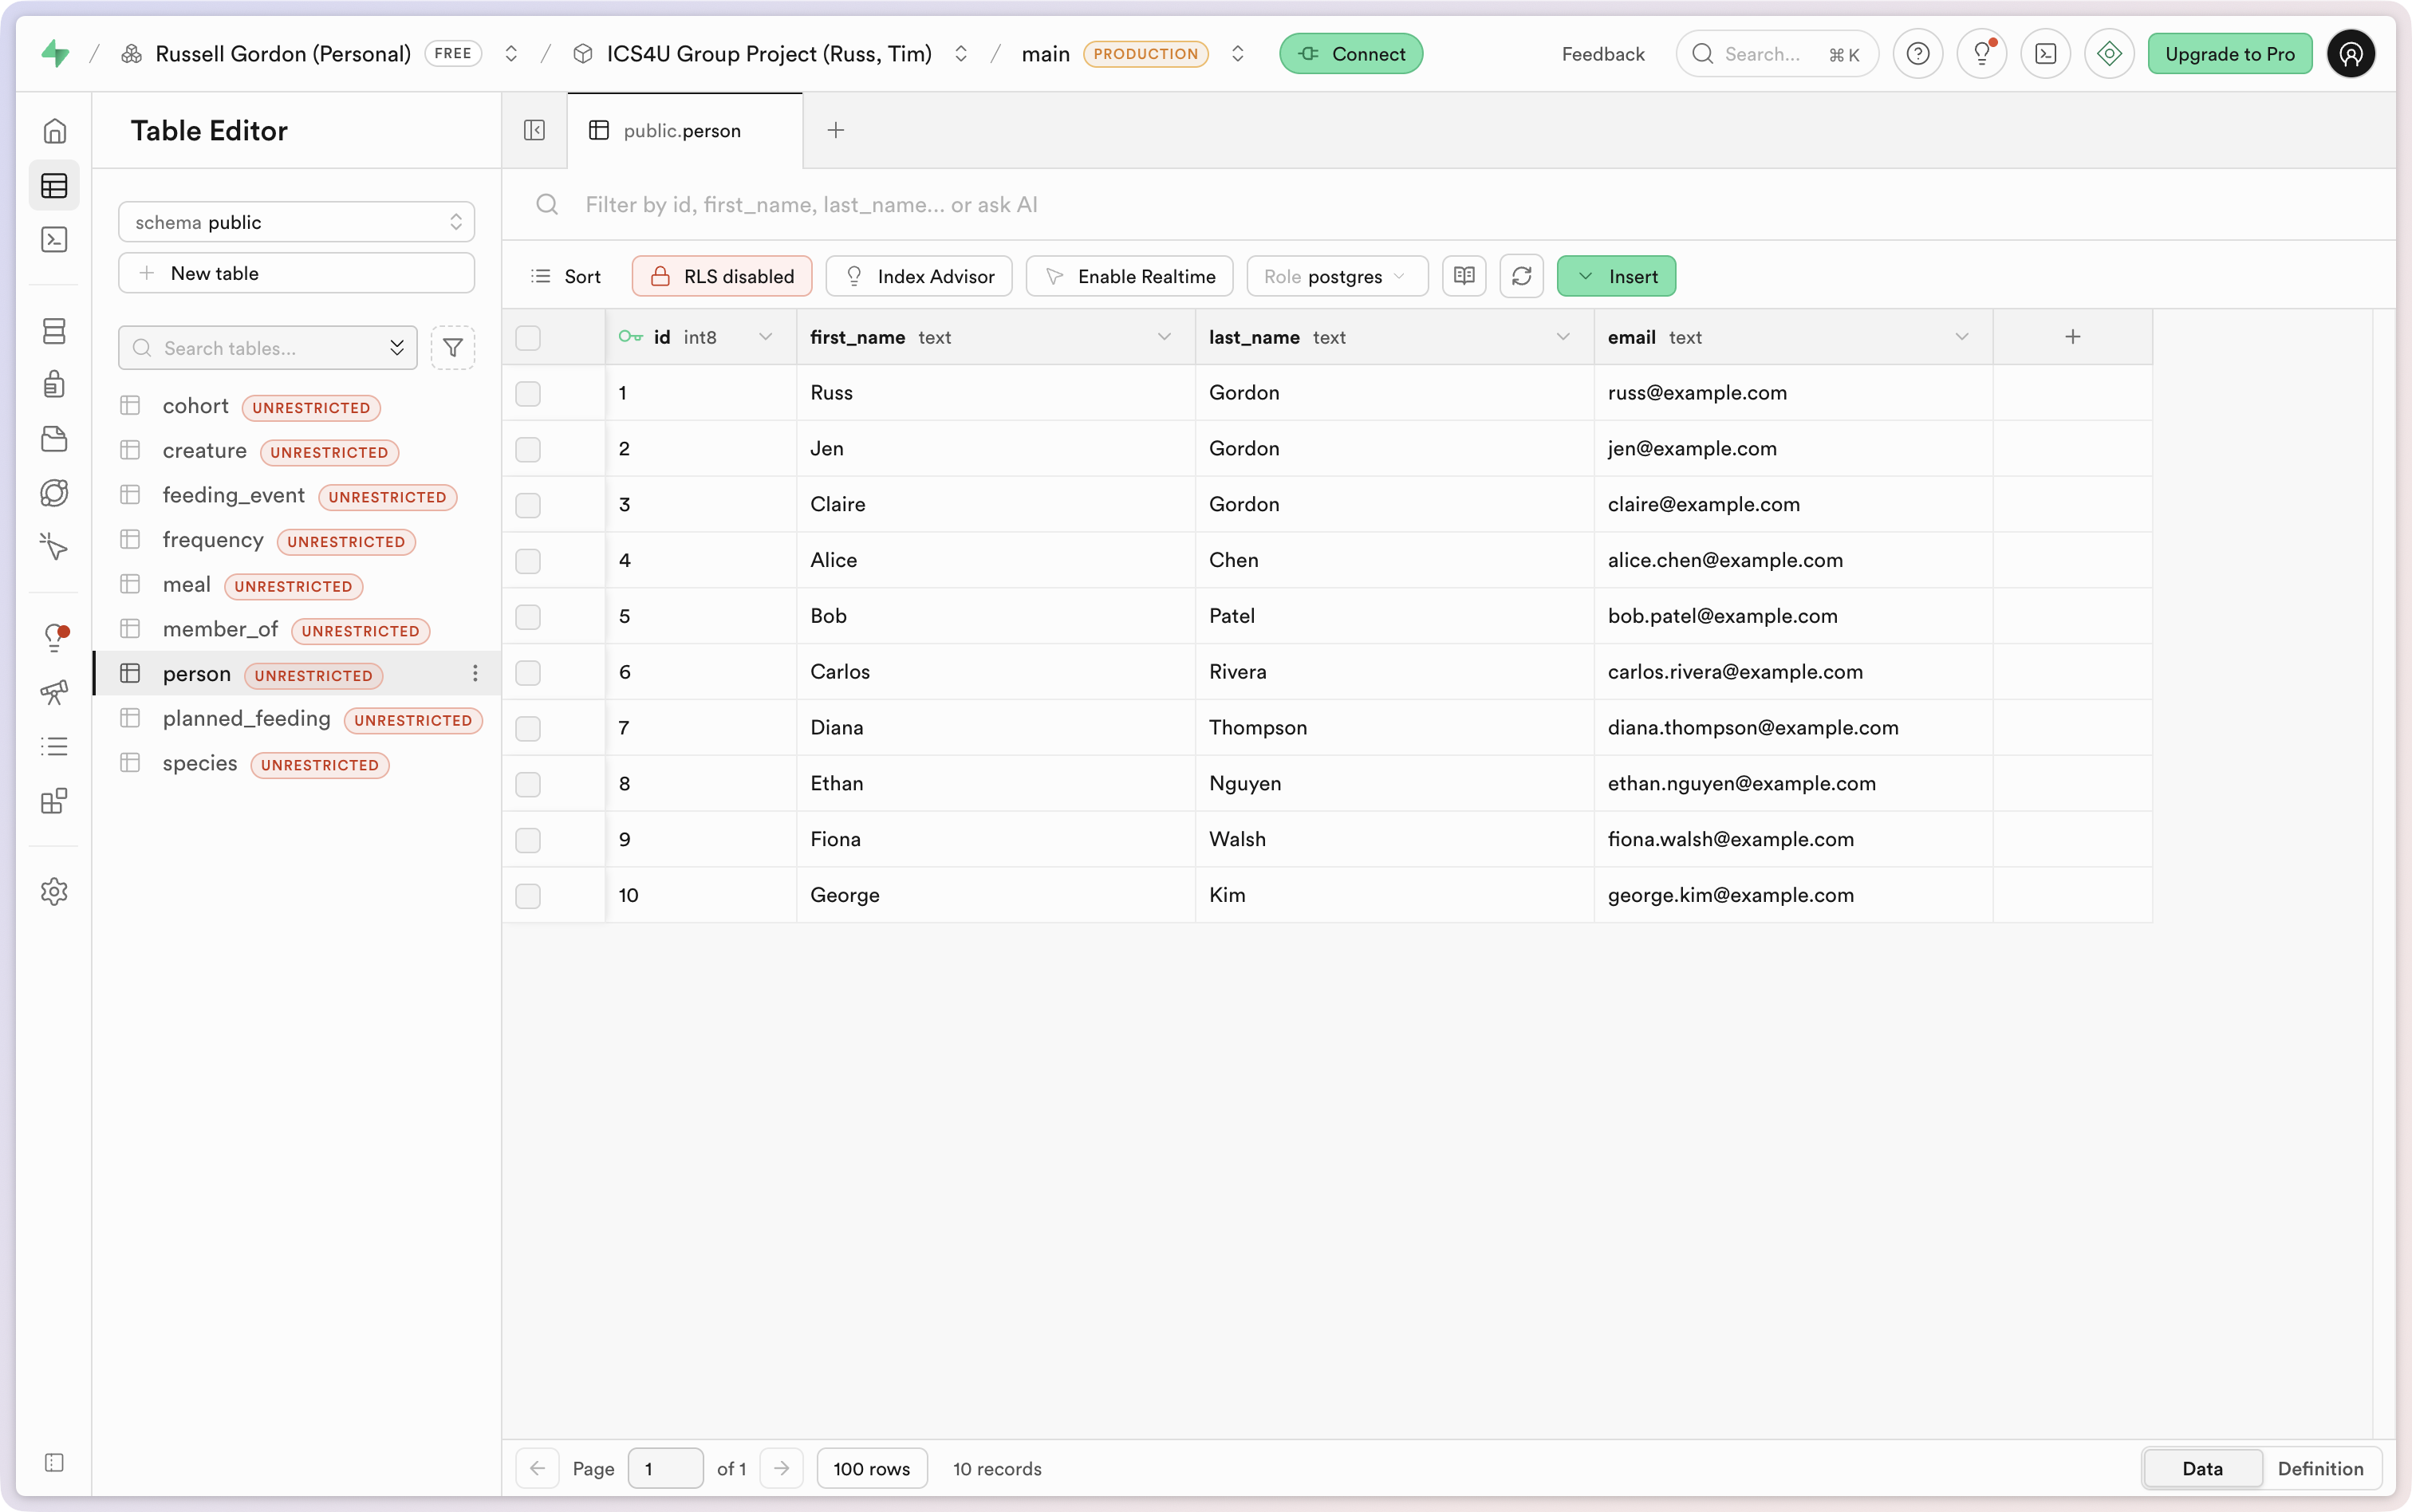
We see that tables contain what looks like reasonable sample data:
Add Supabase dependency
The app will “talk” to the remote database using the Supabase Swift software development kit.
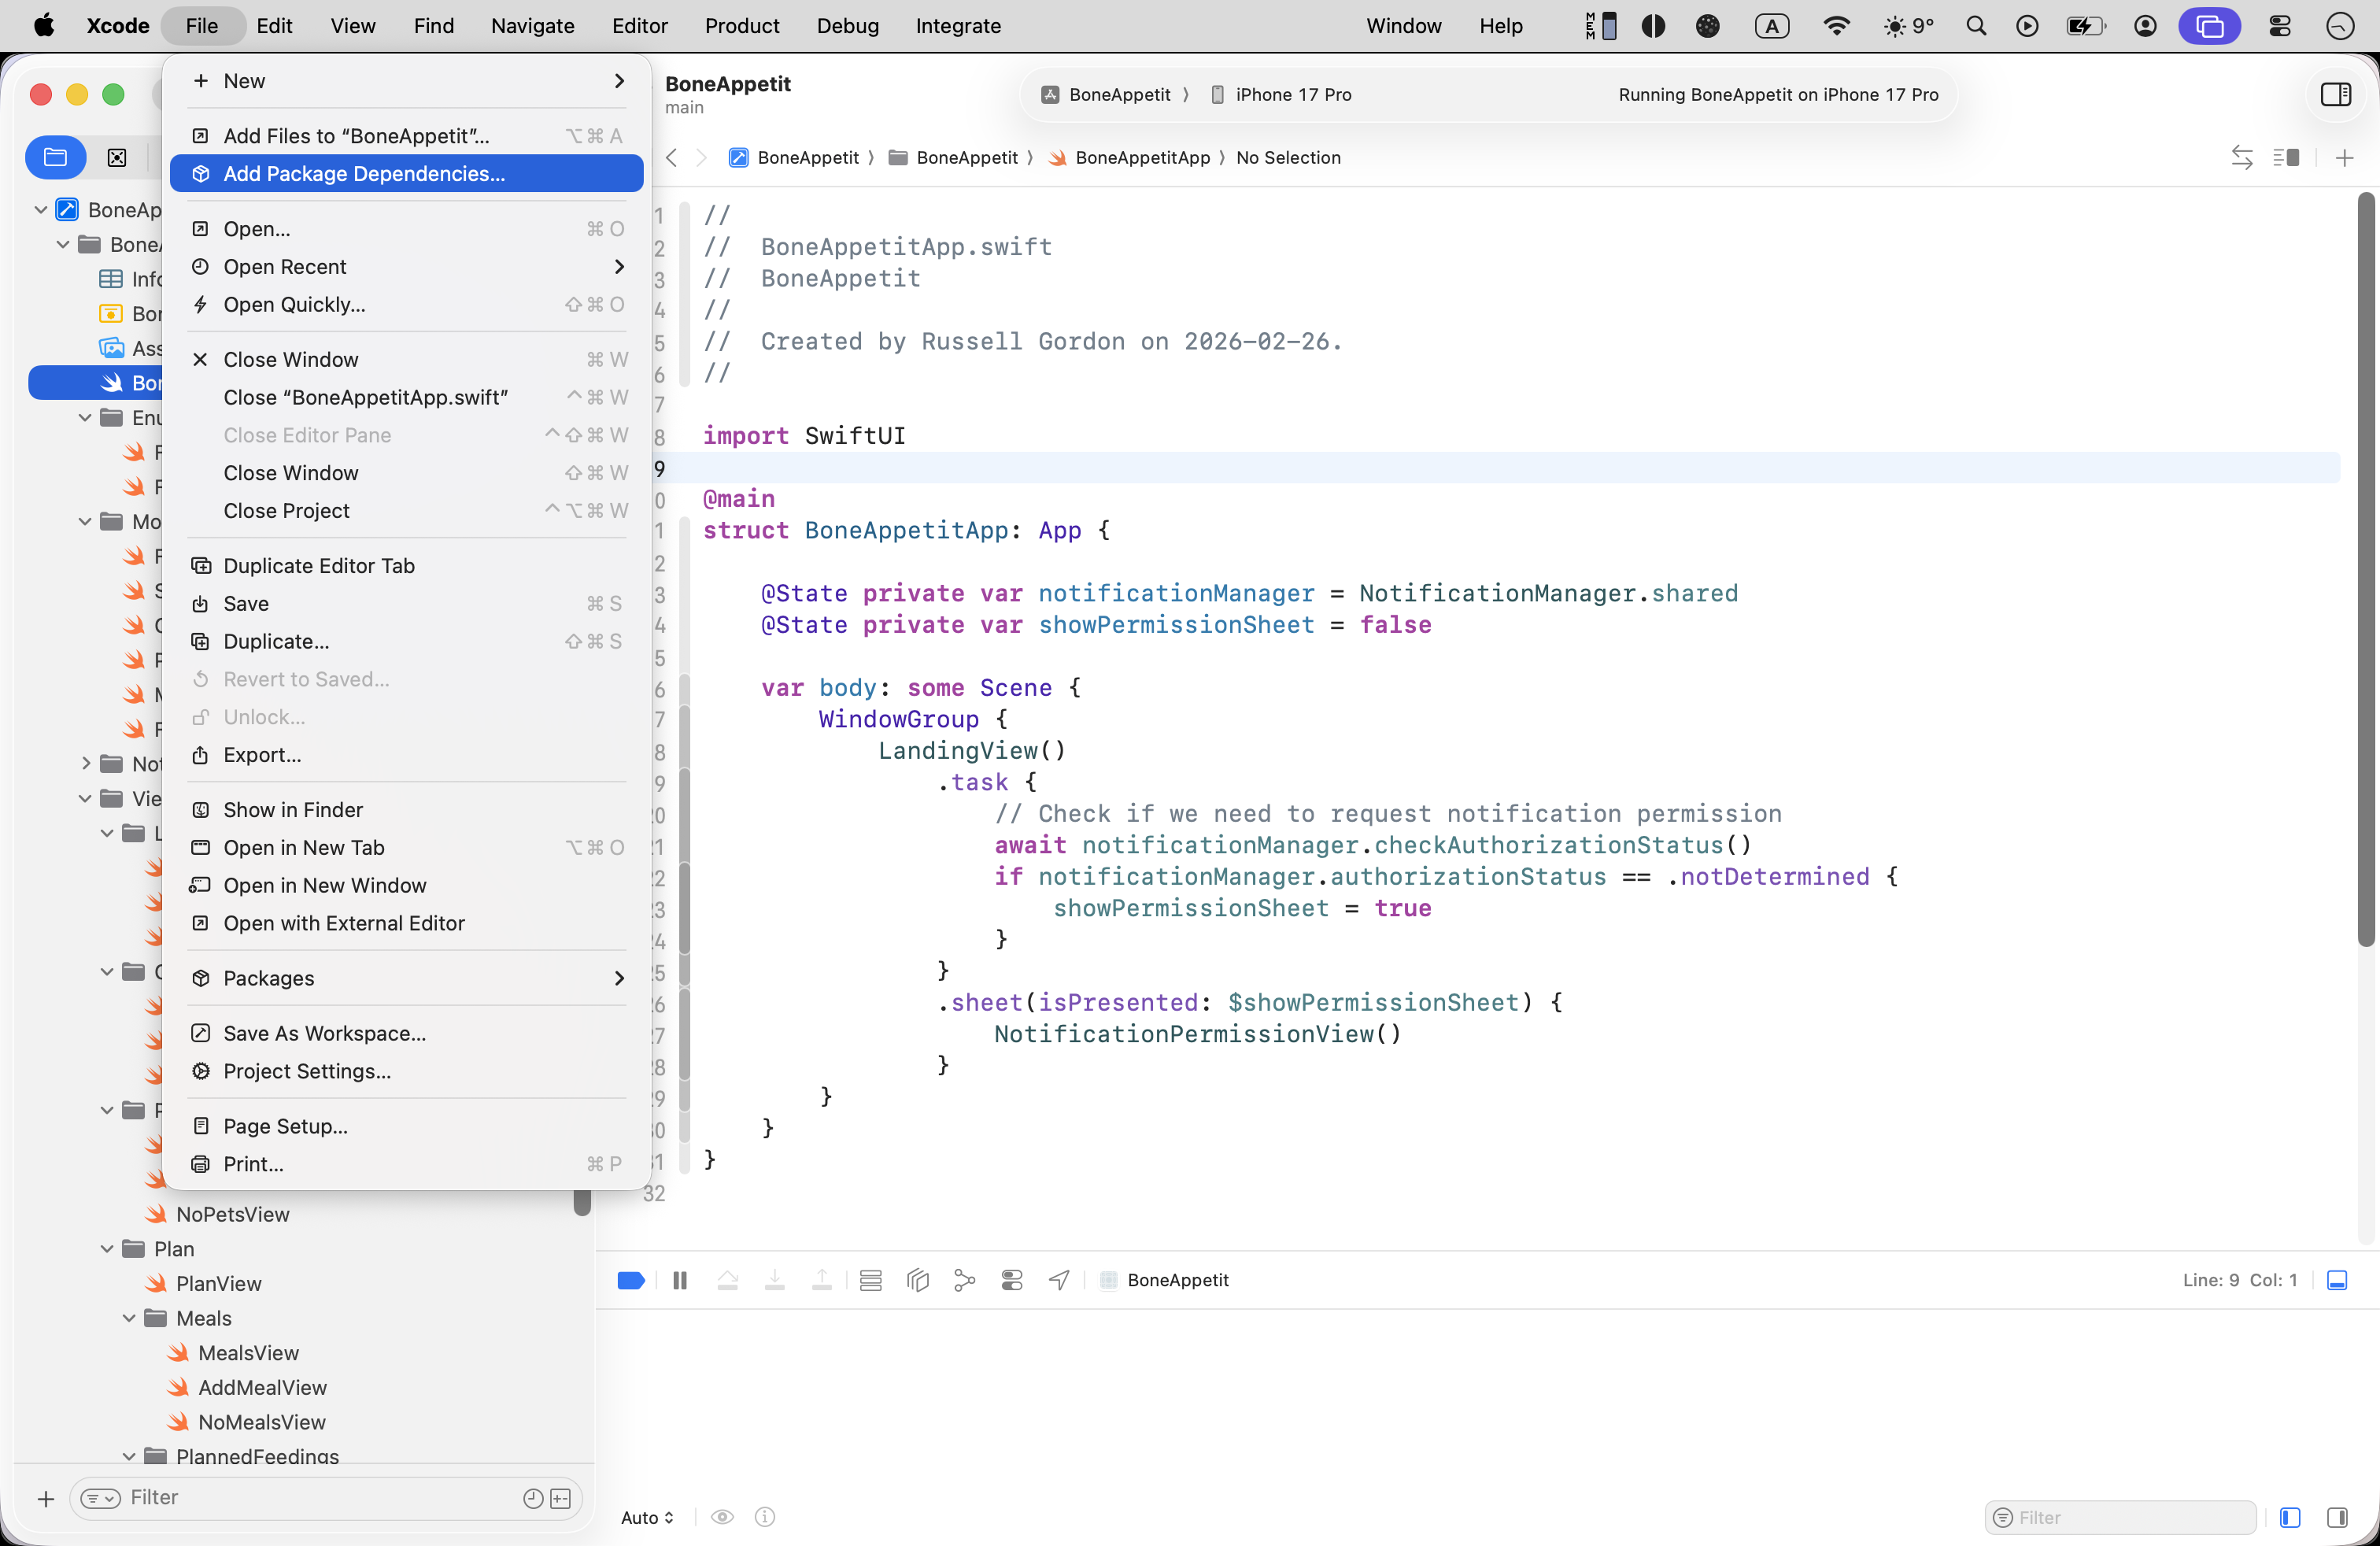
This means adding the package dependency for Supabase by selecting File > Add Package Dependencies…
Then pasting this URL:
https://github.com/supabase-community/supabase-swift.git
… into the search field at the top-right corner:
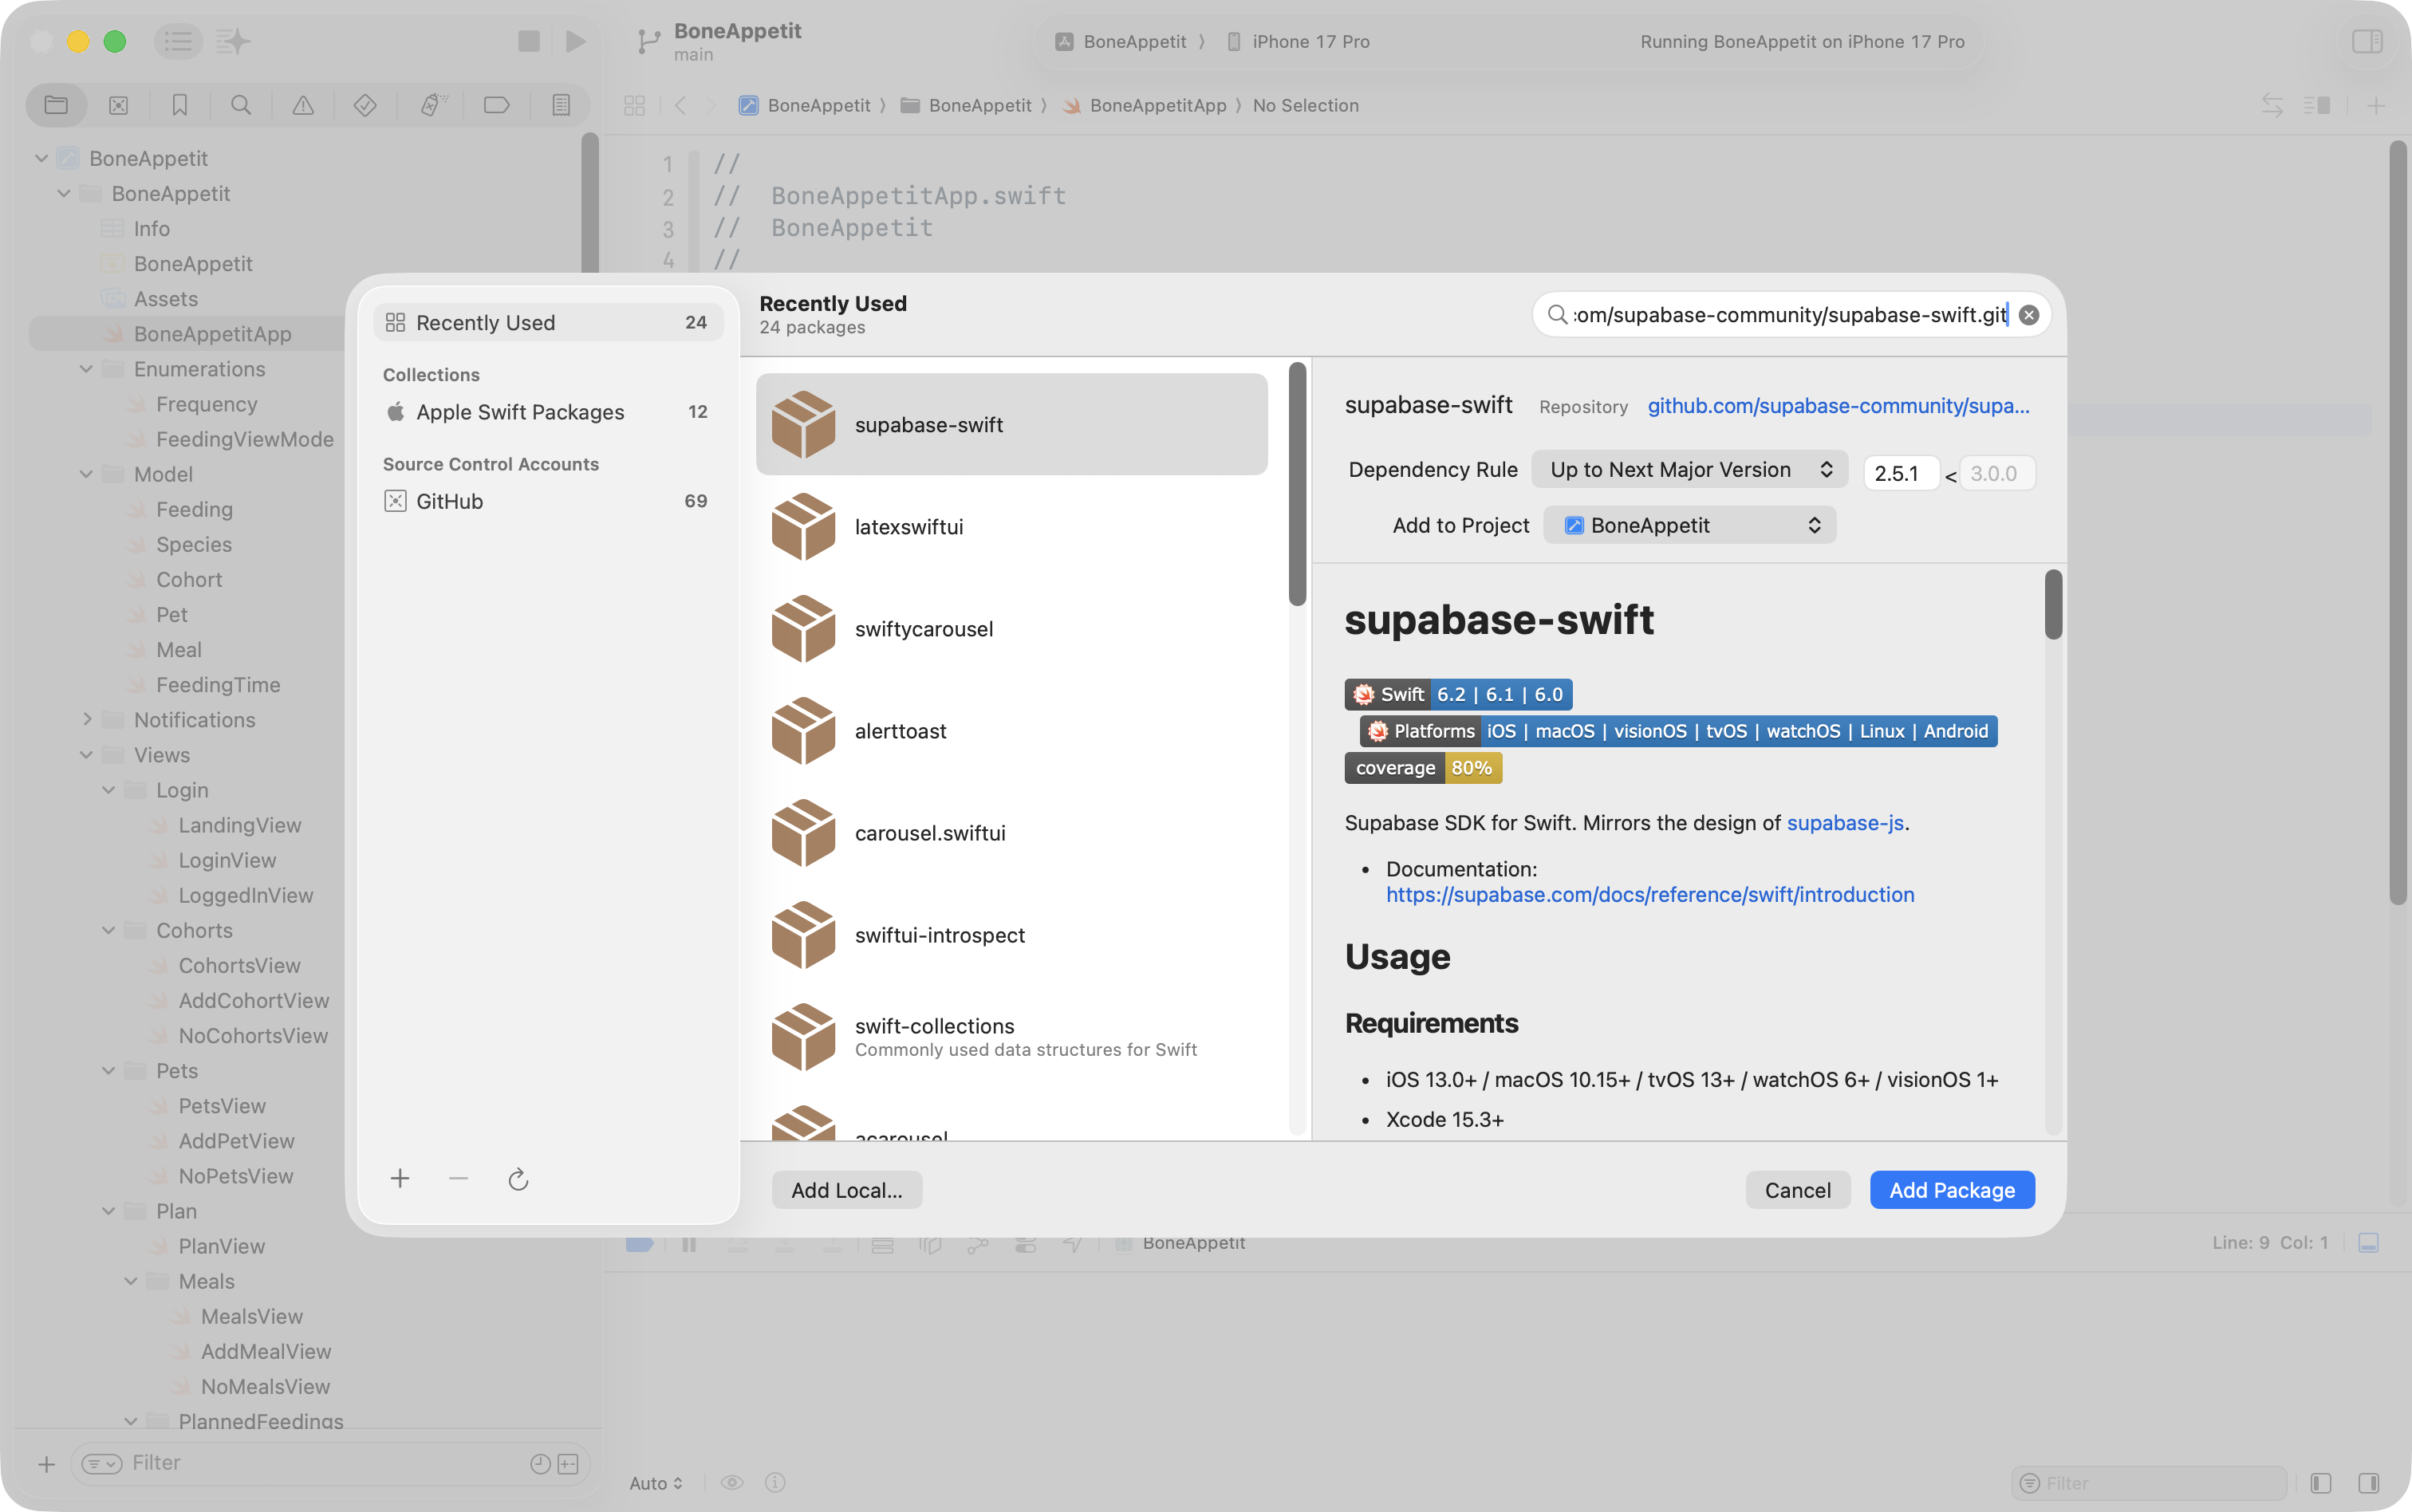
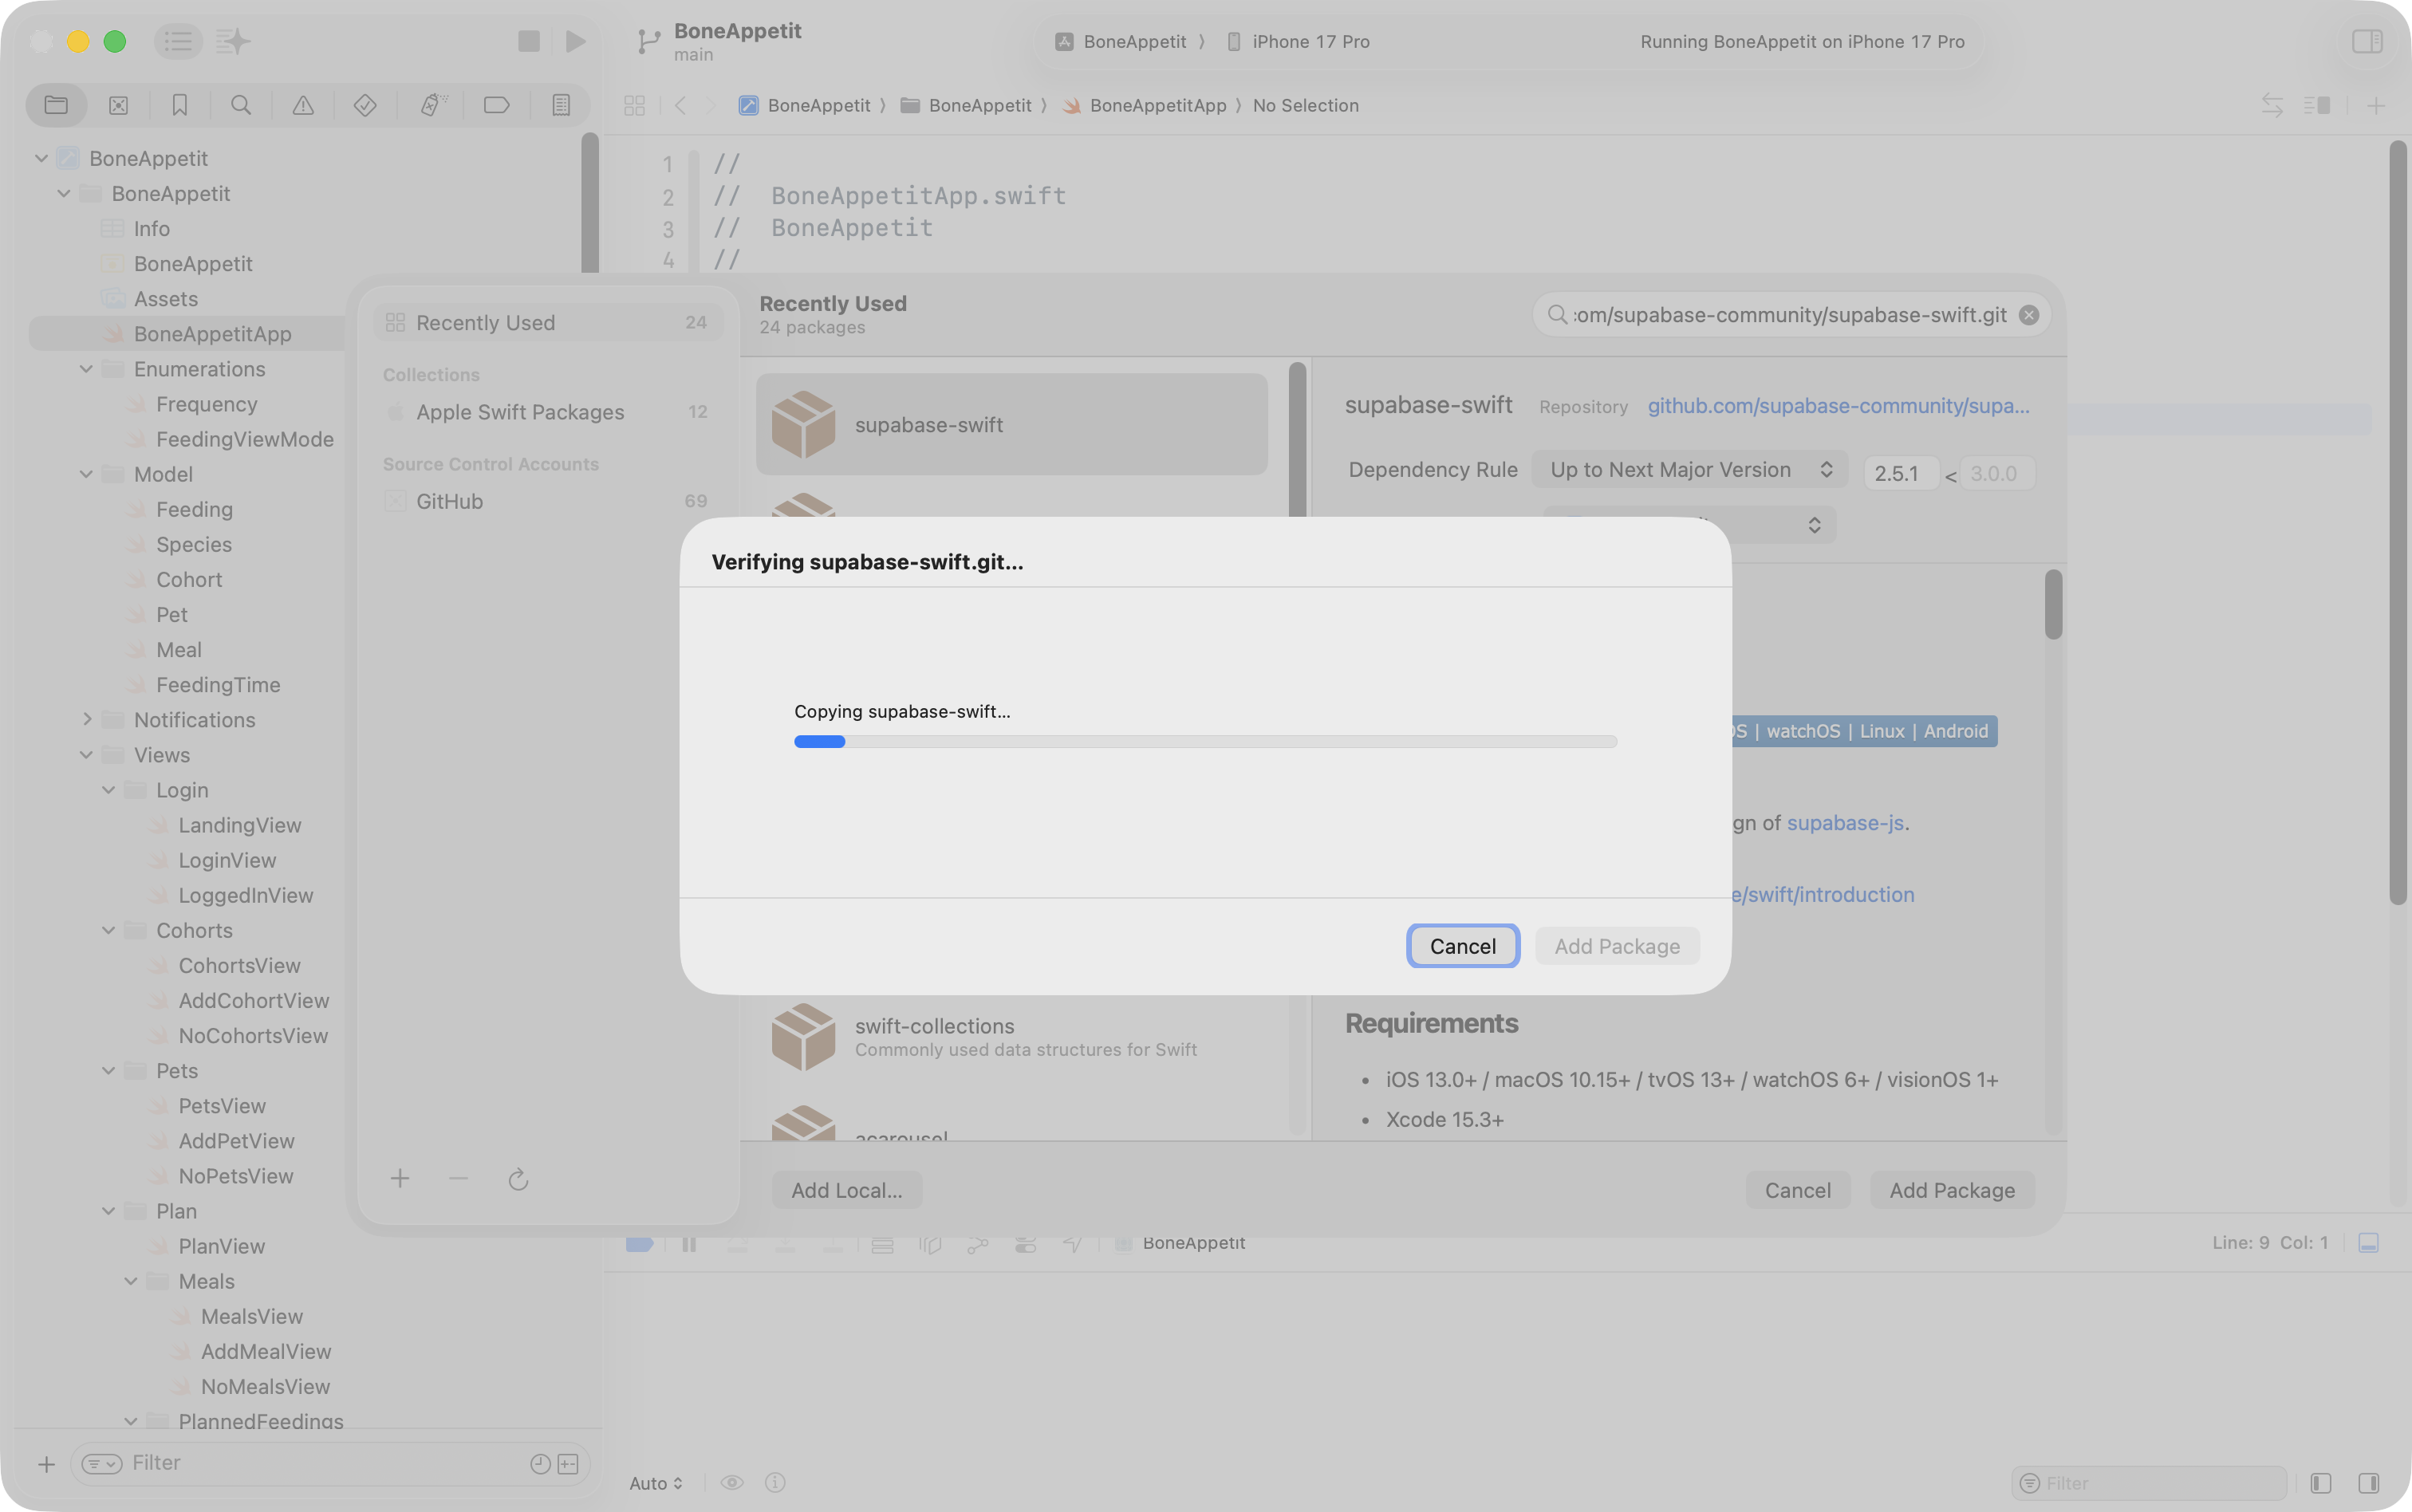
Then we press the Add Package button – we will see an interface like this for a few seconds:
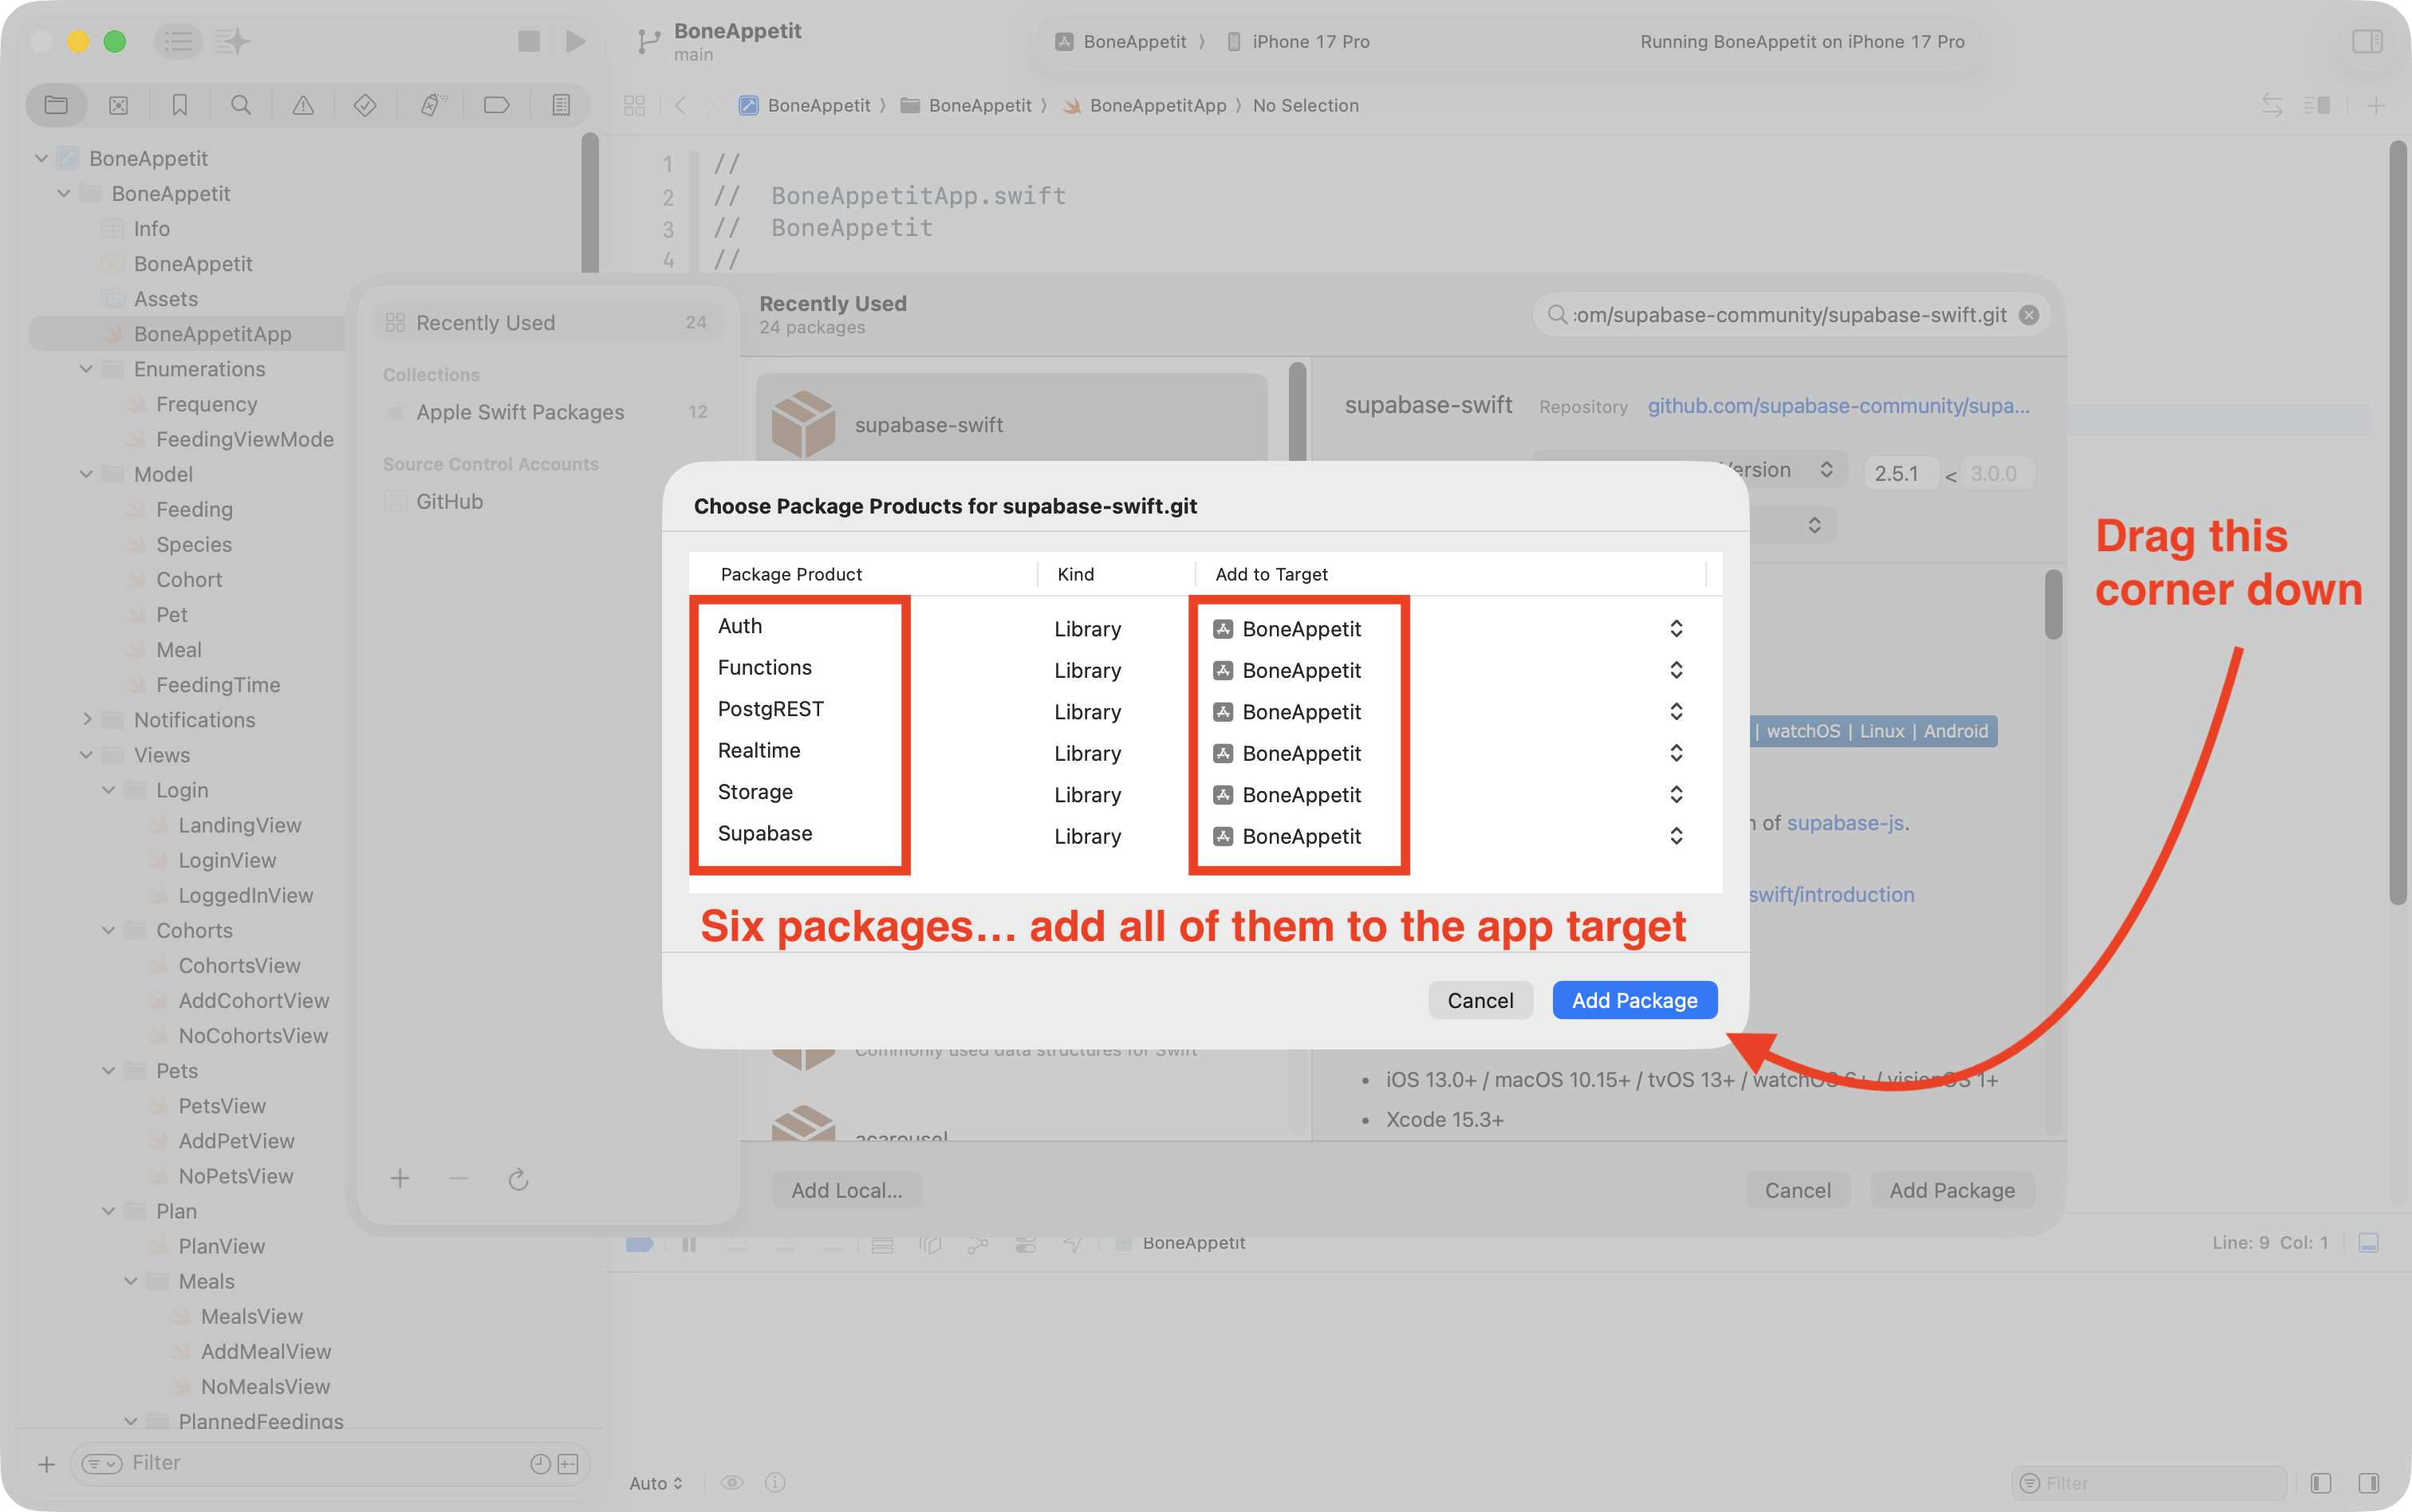
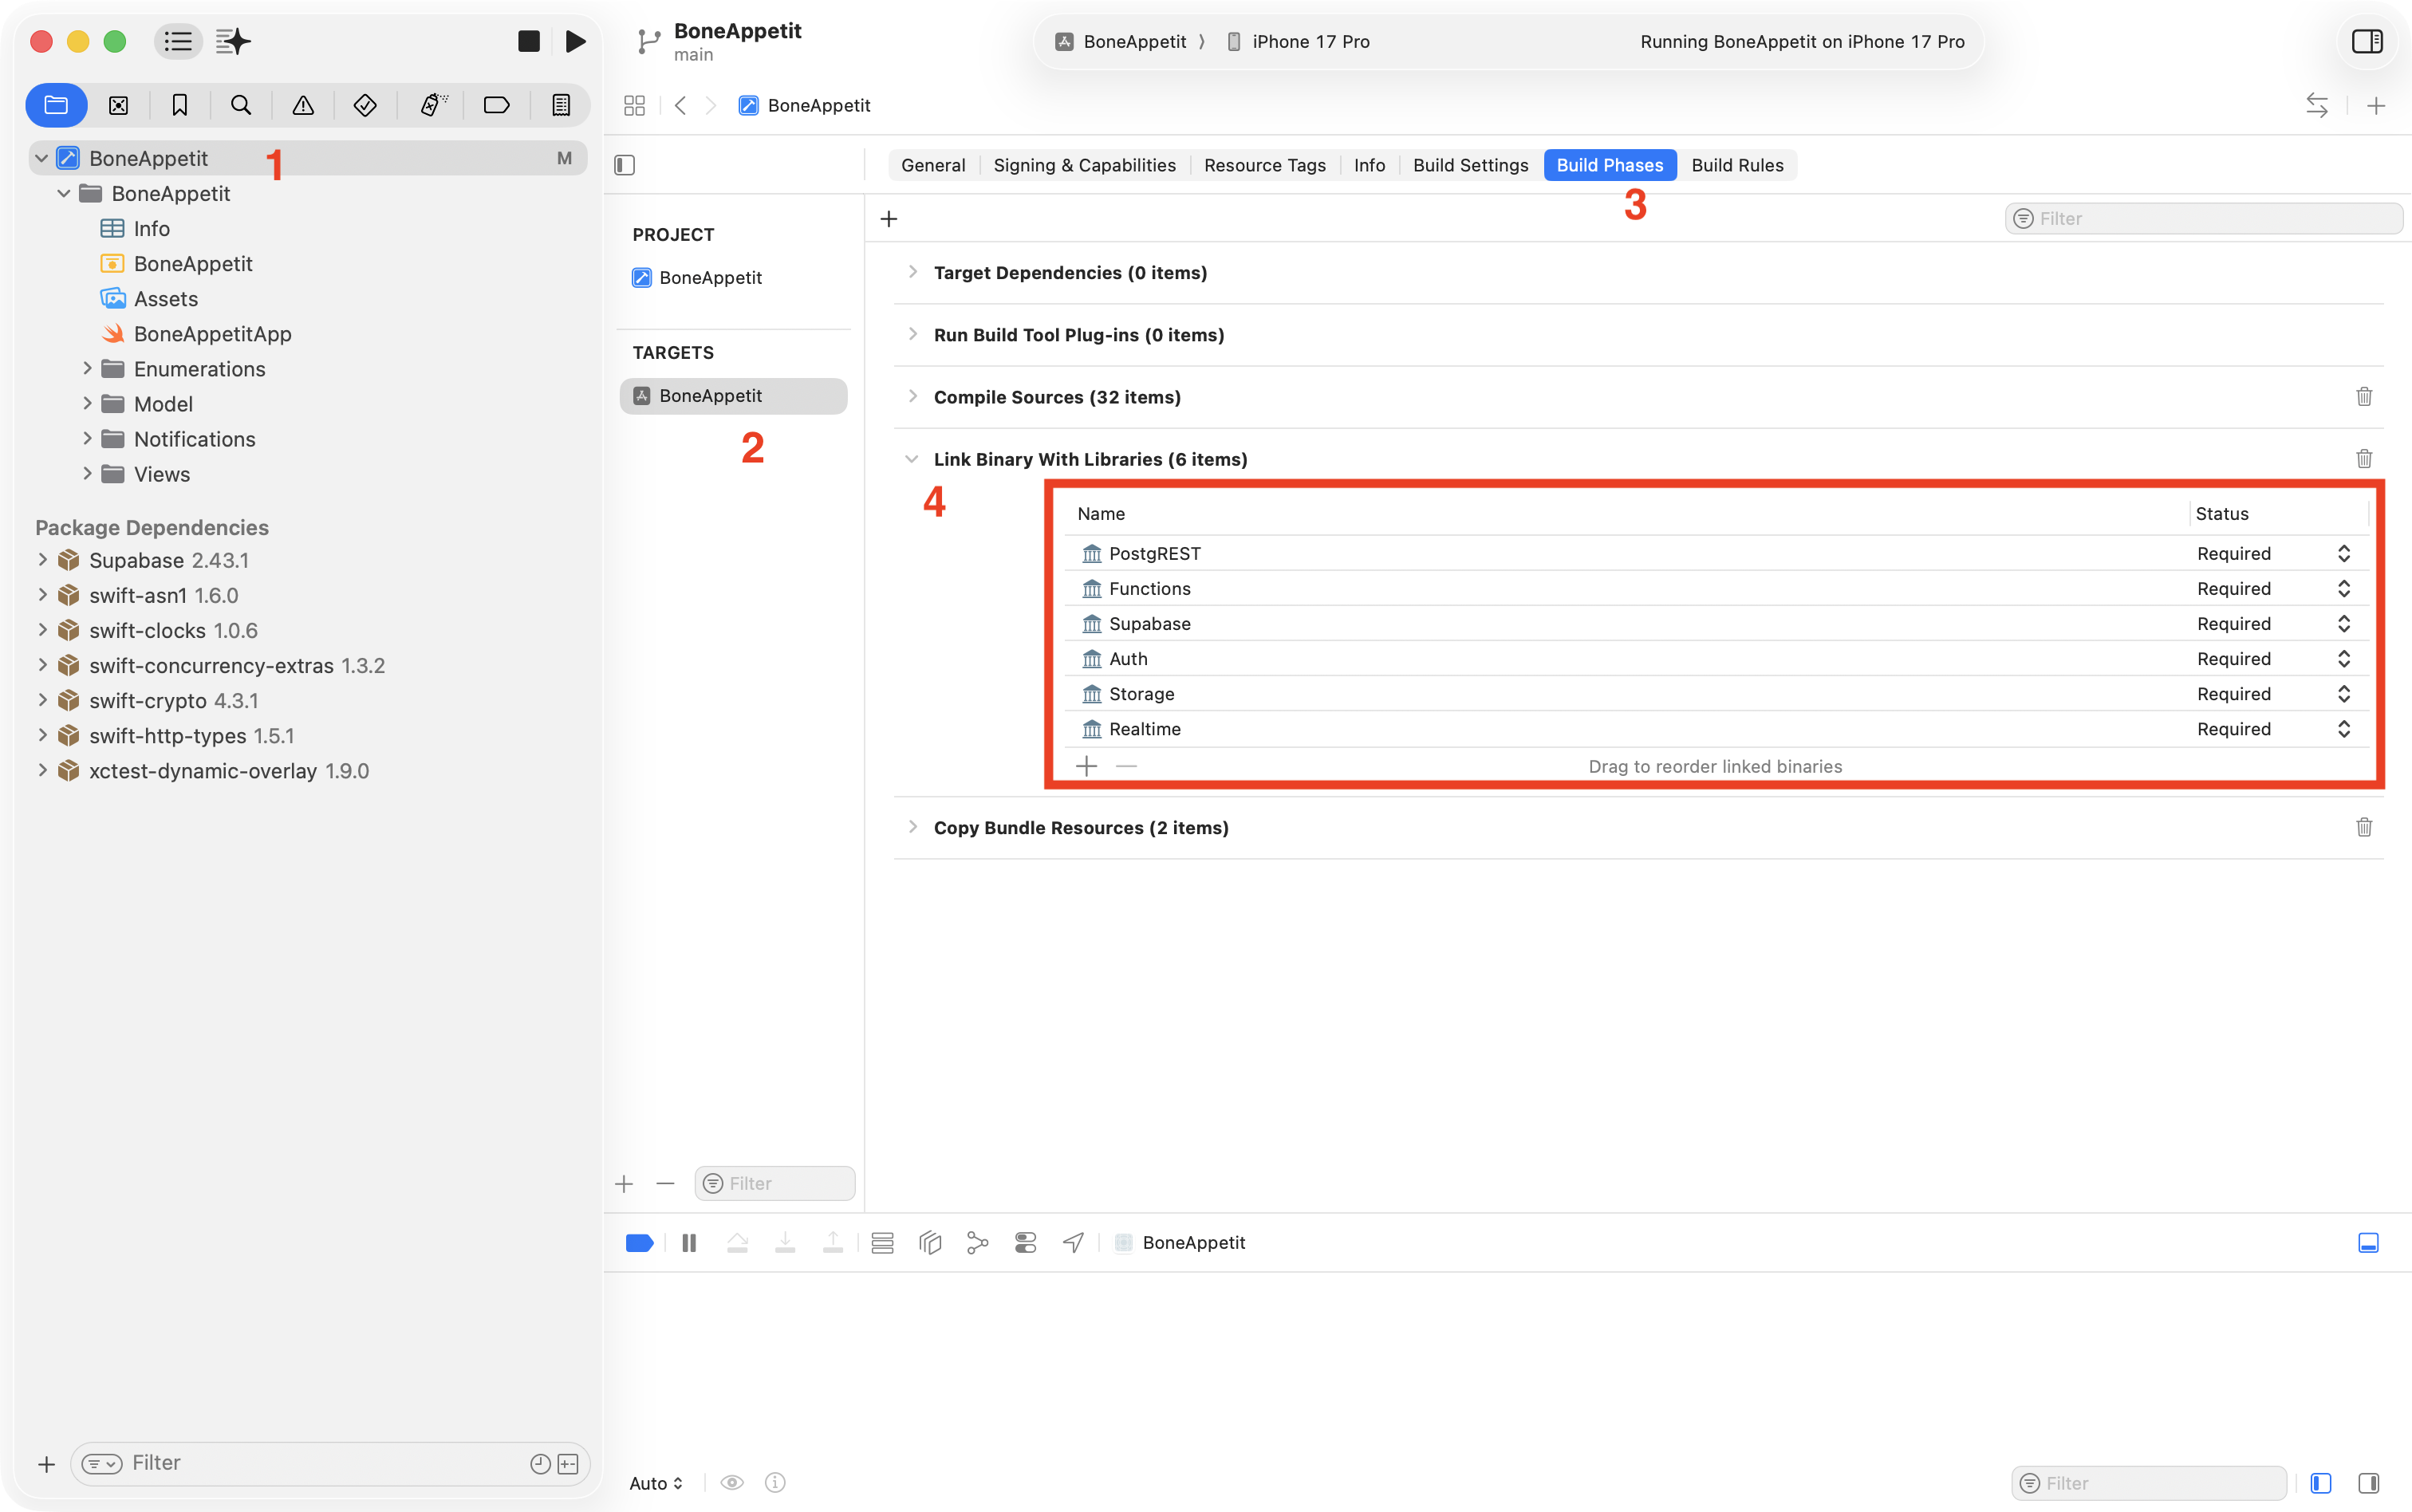
On the next screen, be sure to expand the bottom left corner to see all six dependencies – add them all to the app target – then press Add Package again:
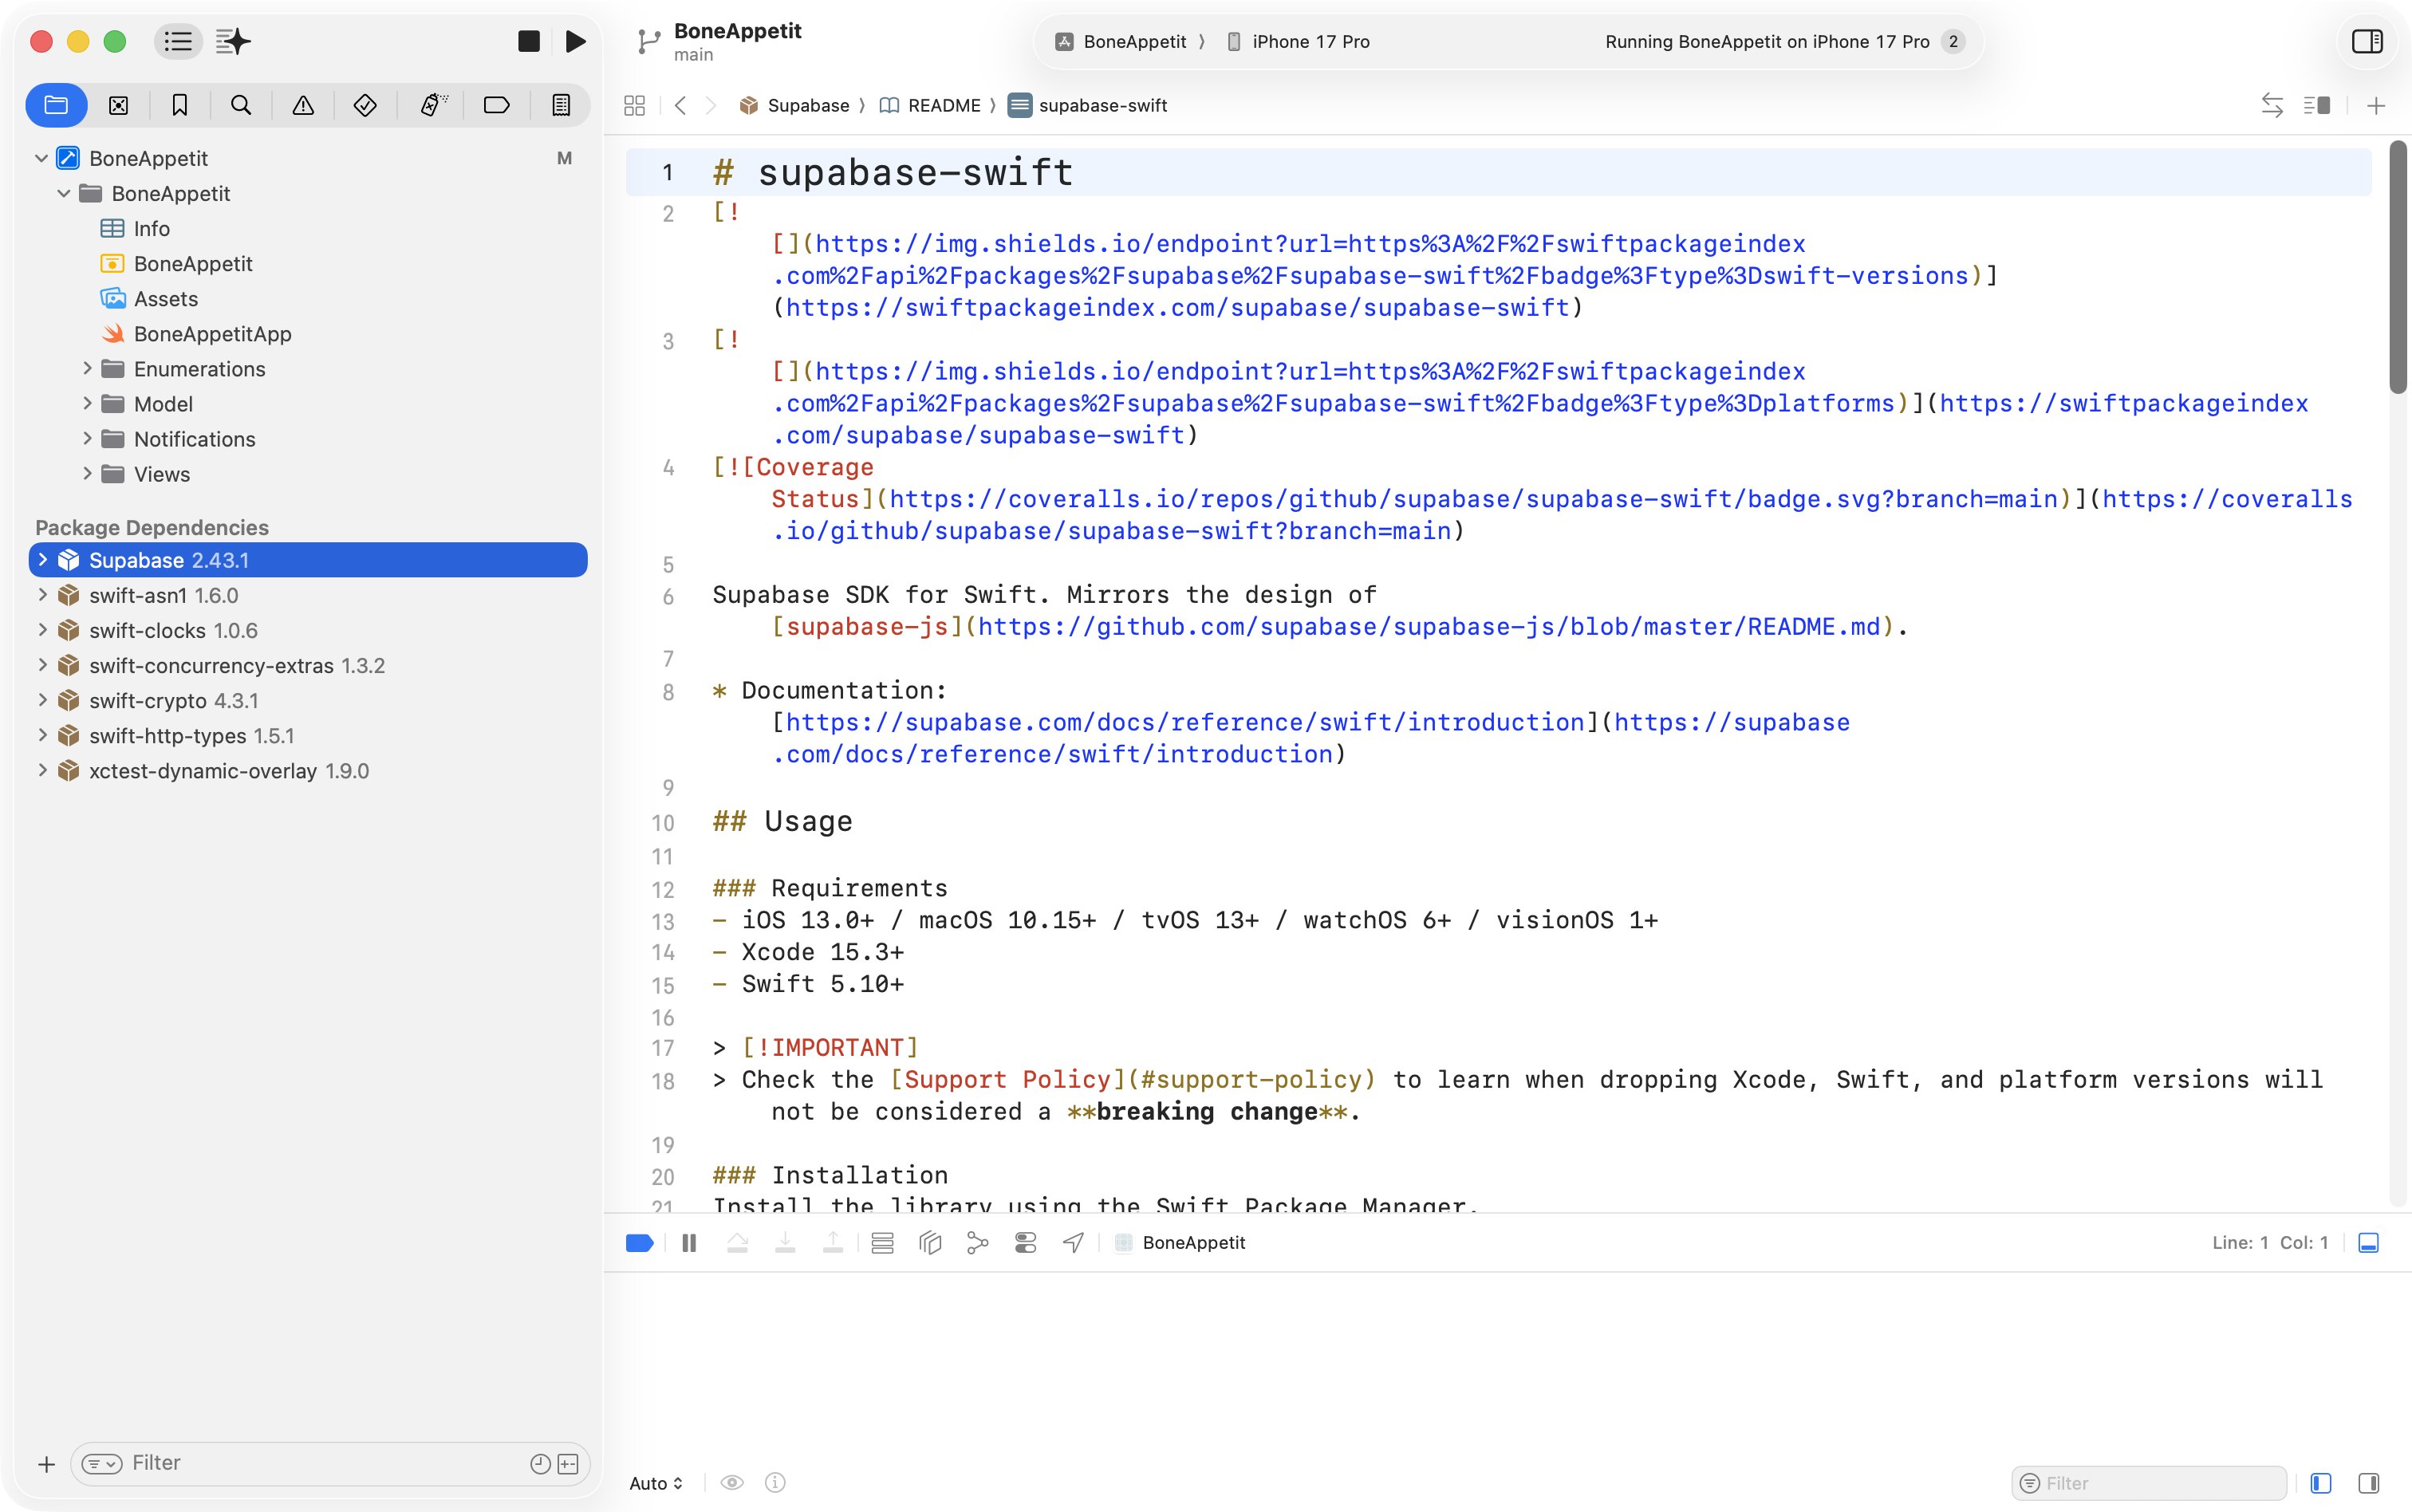
When everything is added successfully, we see the Package Dependencies section at bottom-left looking something like this:
We should double-check using a four click process that all the package dependencies were added:
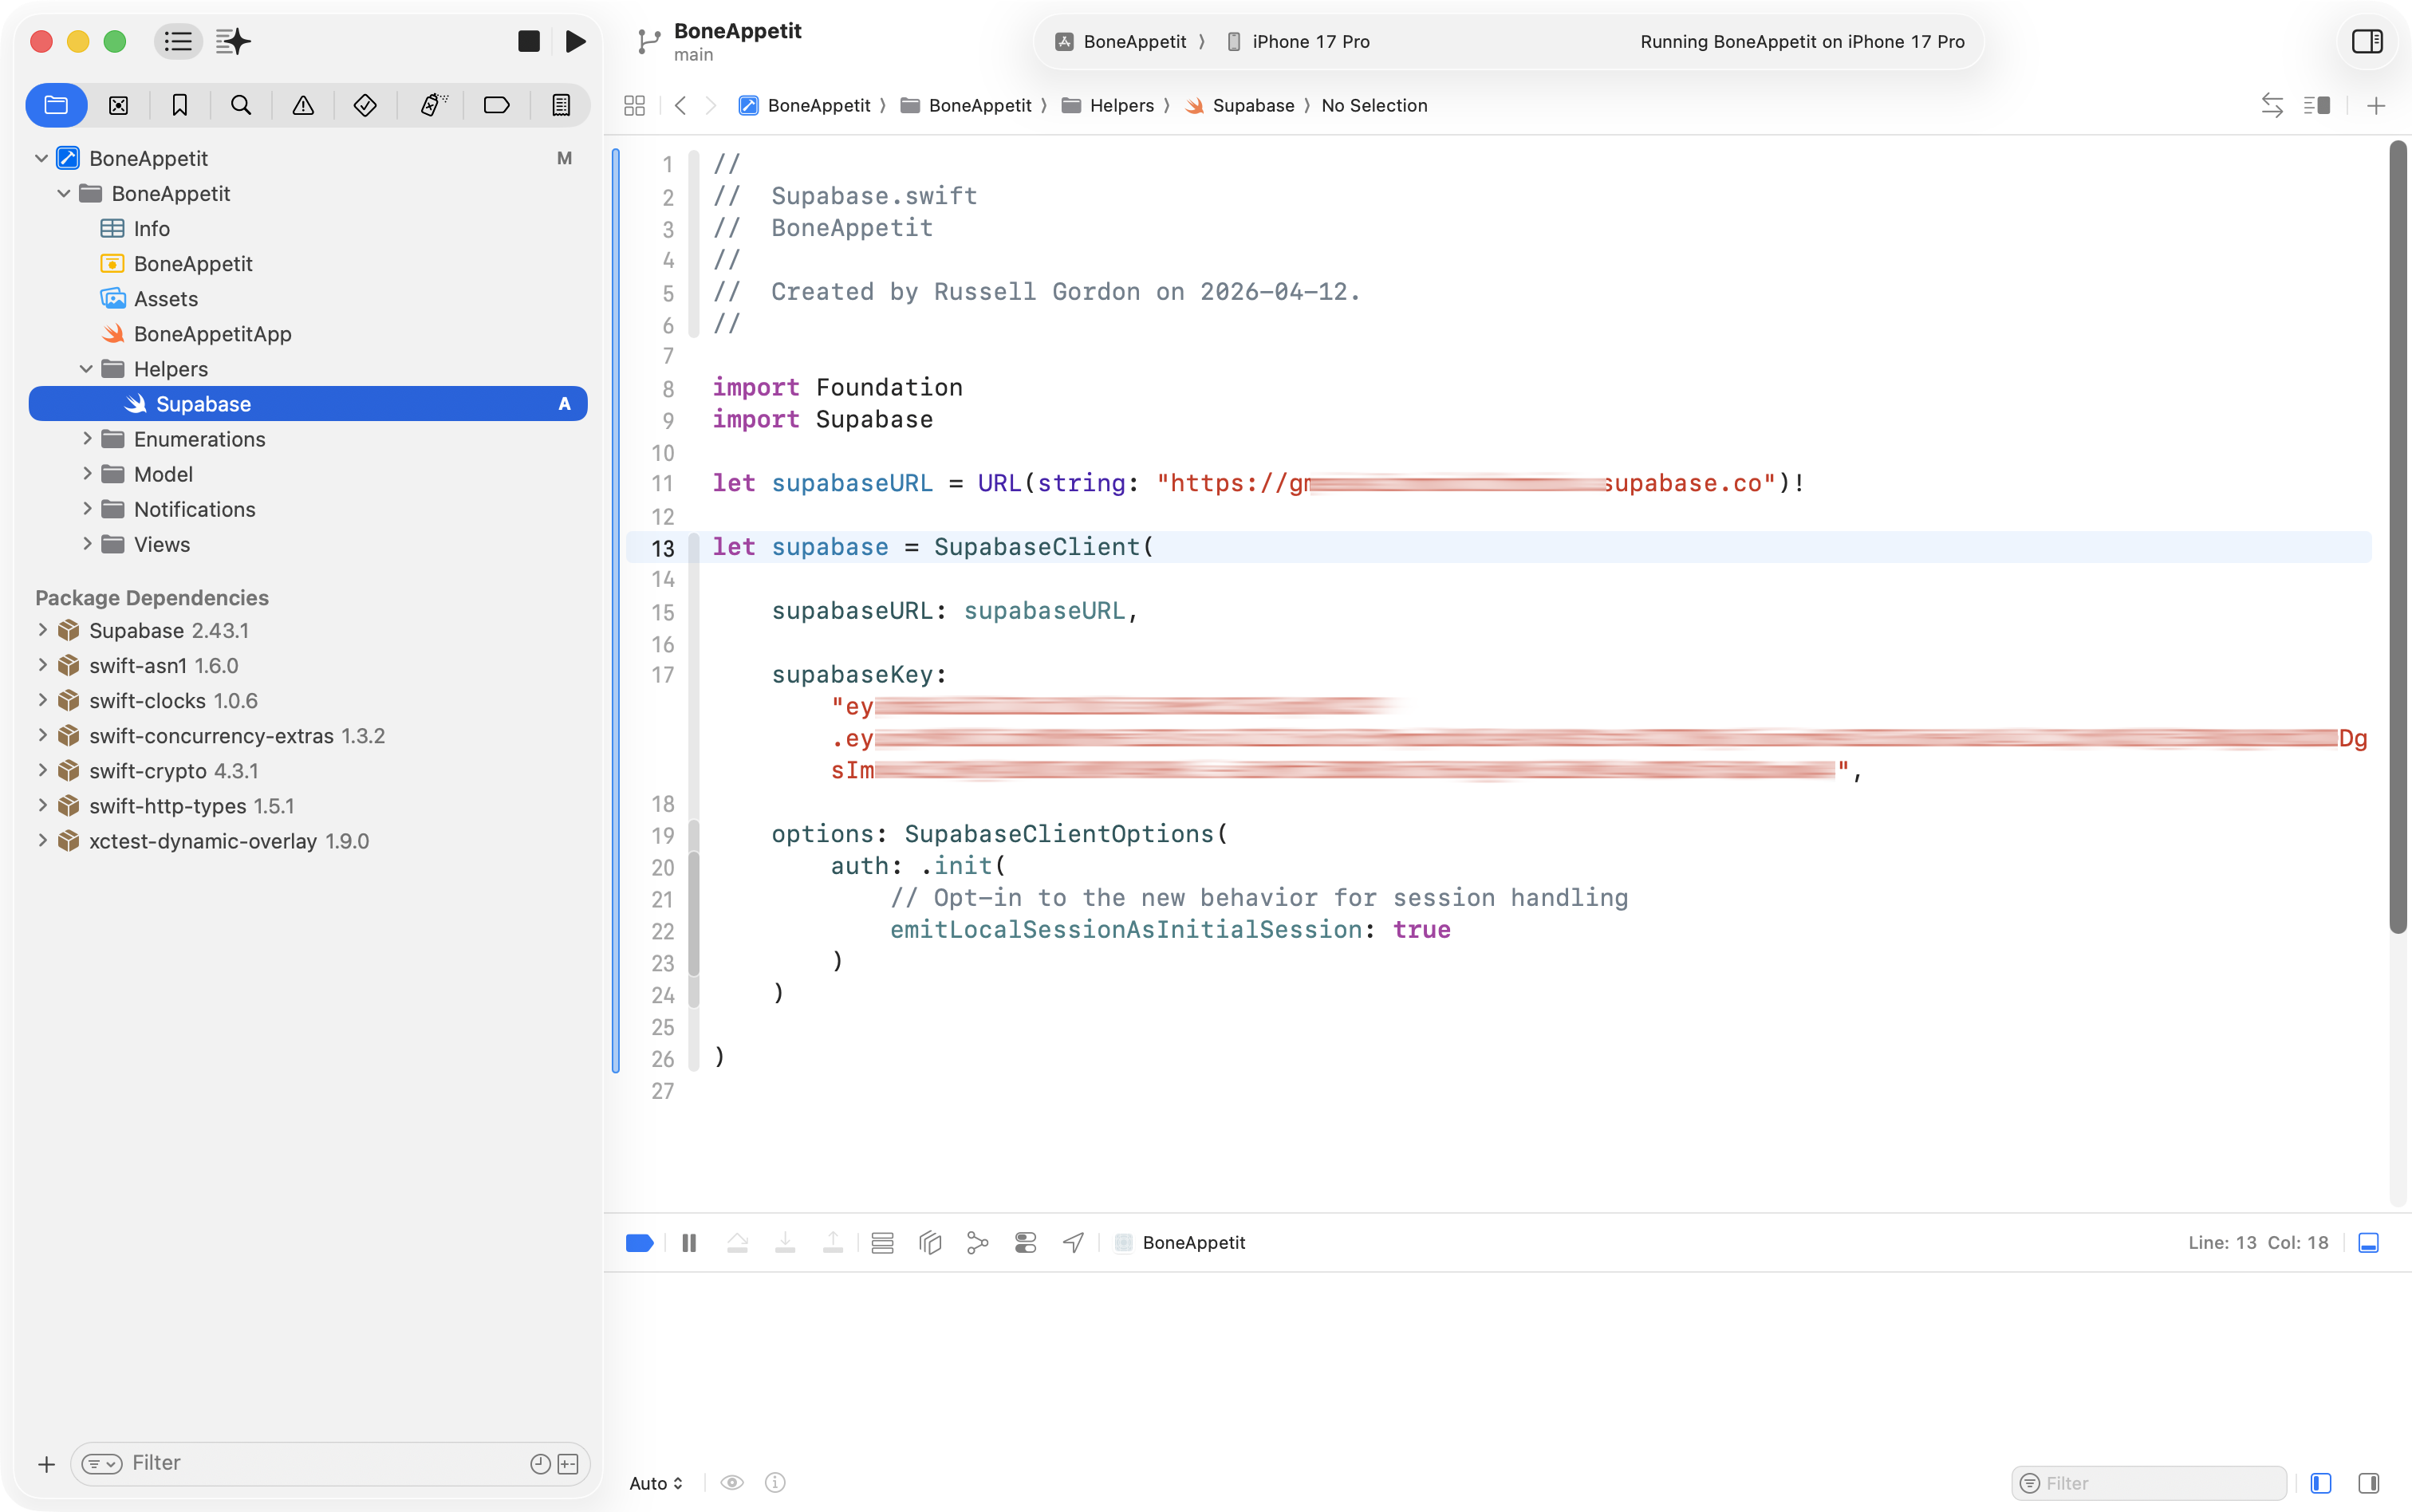
Connect to the Supabase database
To identify an app to Supabase, we must create an instance of SupabaseClient and provide the URL and the anonymous user API key, like this:
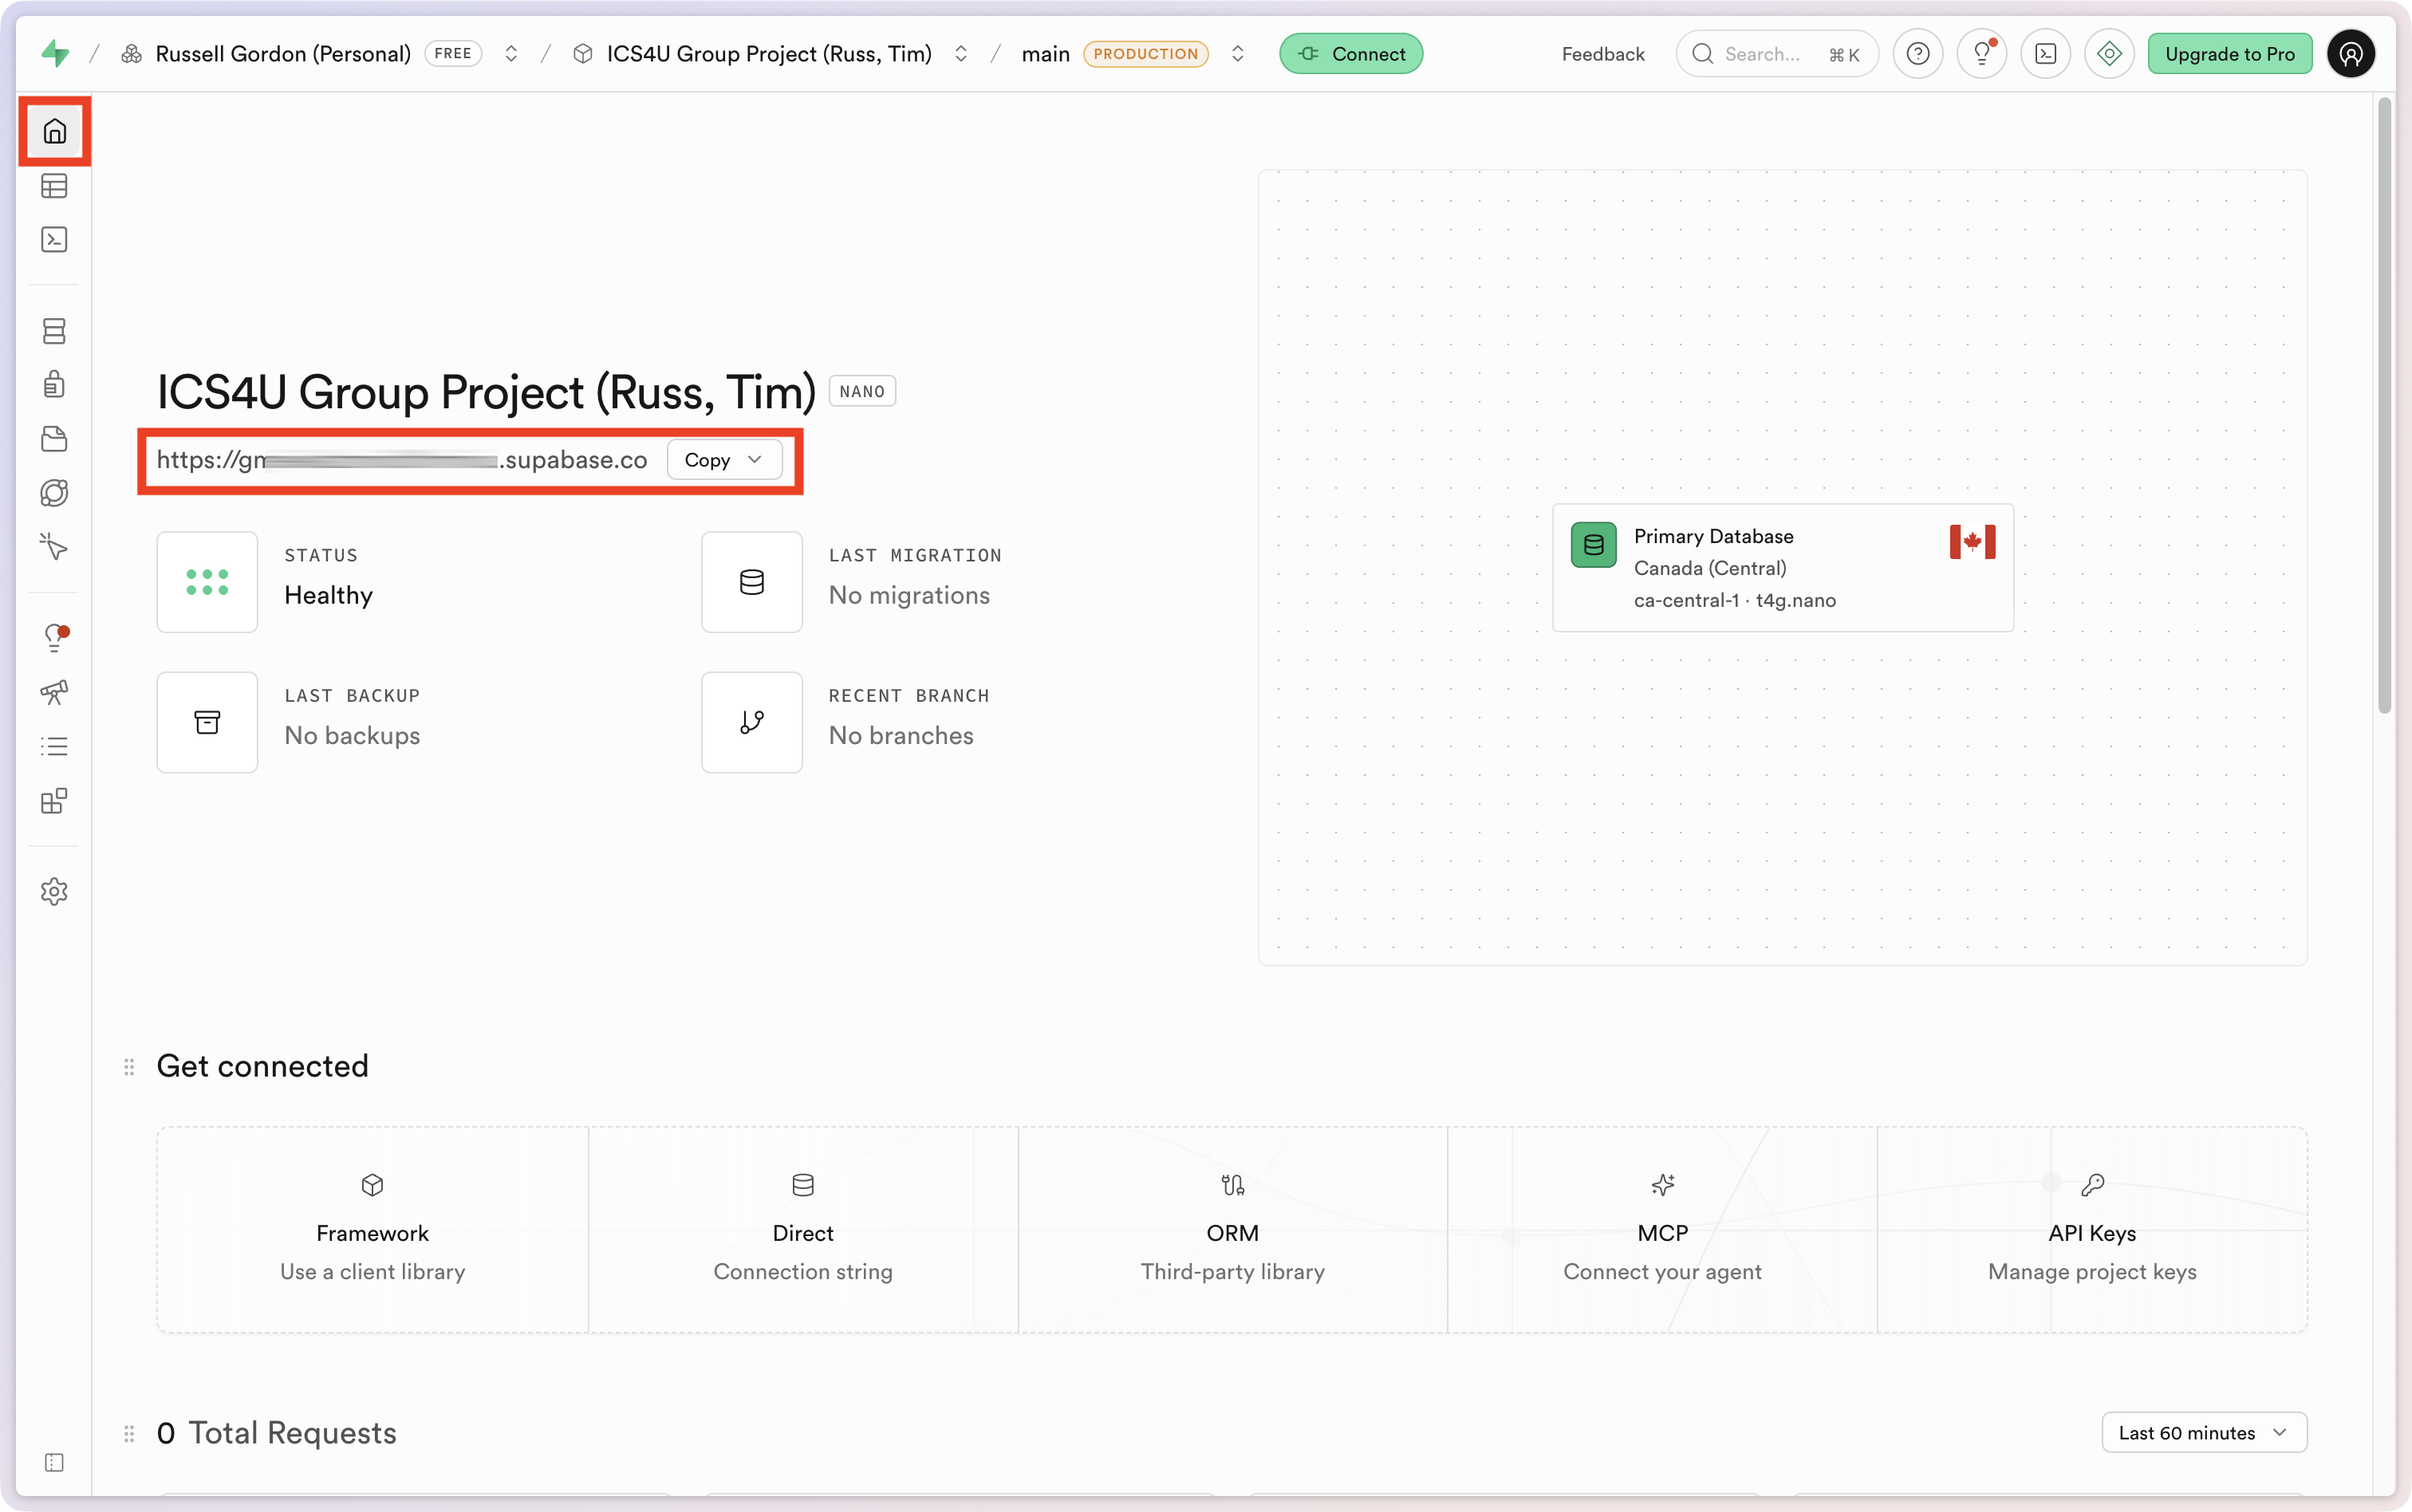
The URL can be found here at Supabase:
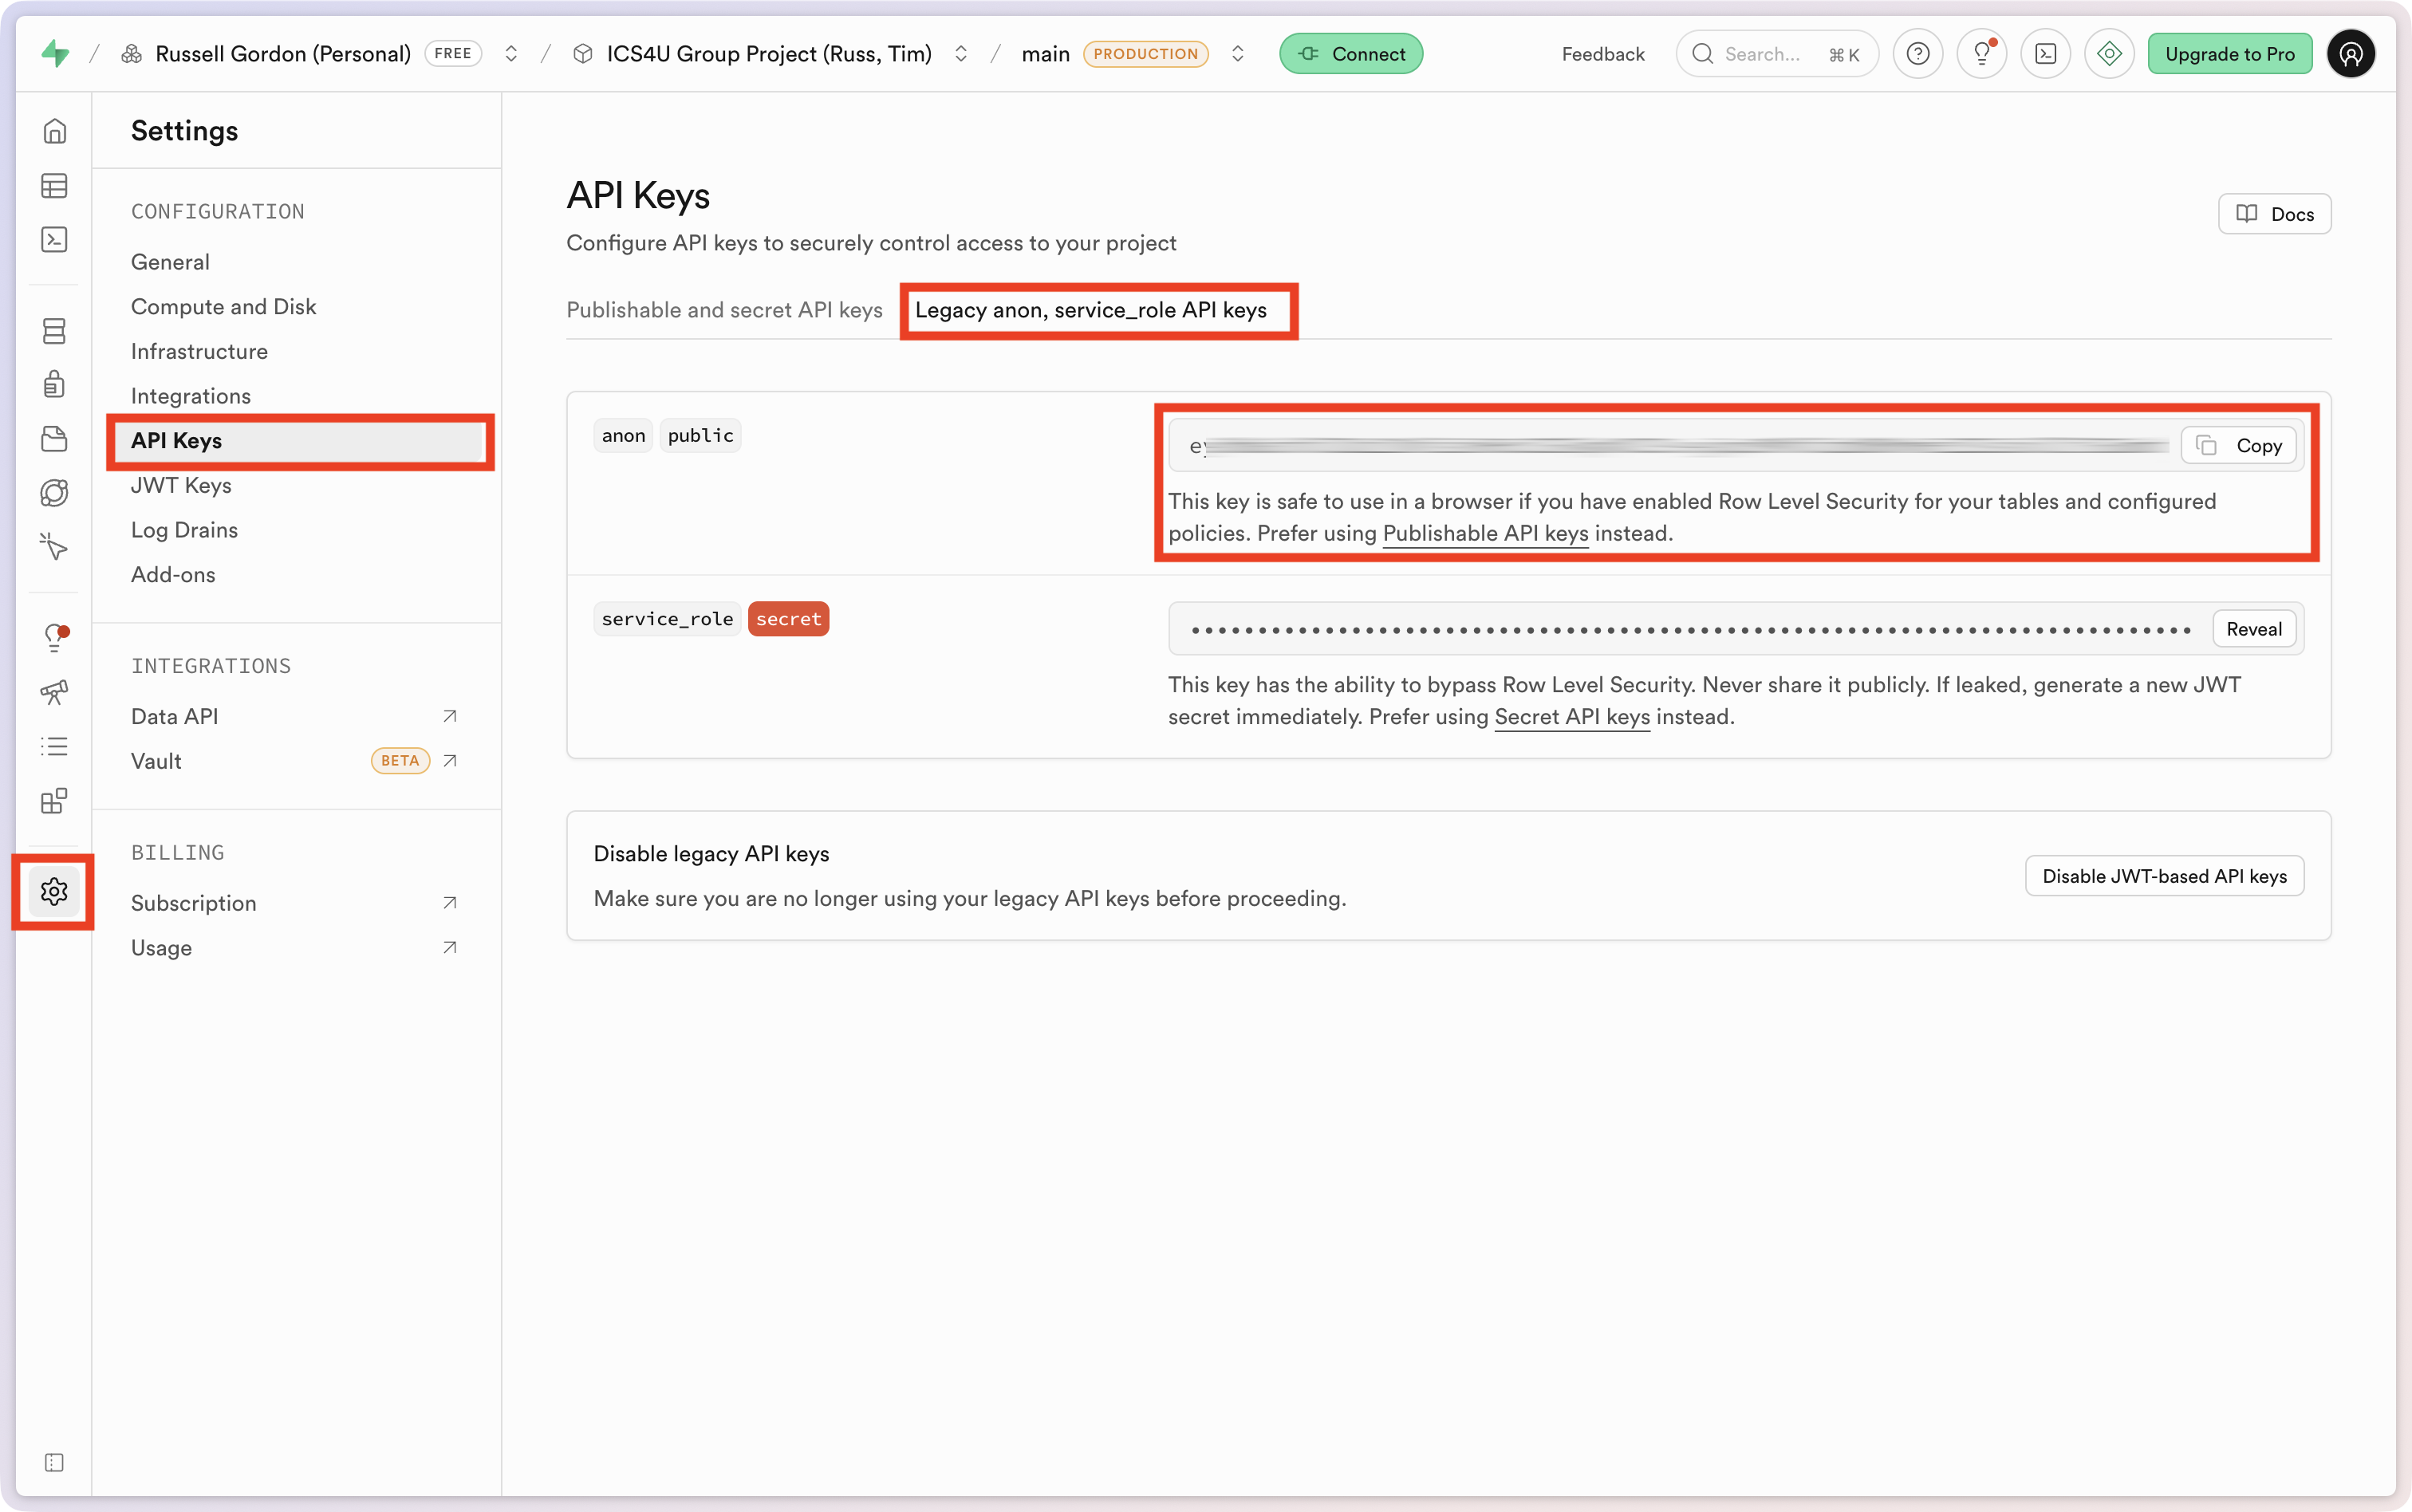
The anonymous user API key can be found here:
Here is a code template that can be used:
import Foundation
import Supabase

let supabaseURL = URL(string: "REPLACE_WITH_PROJECT_URL")!

let supabase = SupabaseClient(

    supabaseURL: supabaseURL,

    supabaseKey: "REPLACE_WITH_ANON_API_KEY",

    options: SupabaseClientOptions(
        auth: .init(
            // Opt-in to the new behavior for session handling
            emitLocalSessionAsInitialSession: true
        )
    )

)
IMPORTANT
The information you are adding to this file allow anyone with that information to connect to your database.
Since we have not yet set up authentication or enabled row-level security within our database, publishing the database URL and anonymous access key in, for example, a public GitHub repository, is a significant security problem.
Be sure that you are using a private repository before you make any further pushes to your remote GitHub repository.
Use database views
The next step is to build database views to obtain information for parts of the application in question – in essence – “bring it to life” by showing information within the app that is drawn from the database.
How to do this is covered extensively in the existing Electric Ride tutorial.
What follows is a summary of next steps taken to build Bone Appétit.
The first screen that contains data to be pulled from the database is the part of the user interface that displays cohorts a person is a member of:
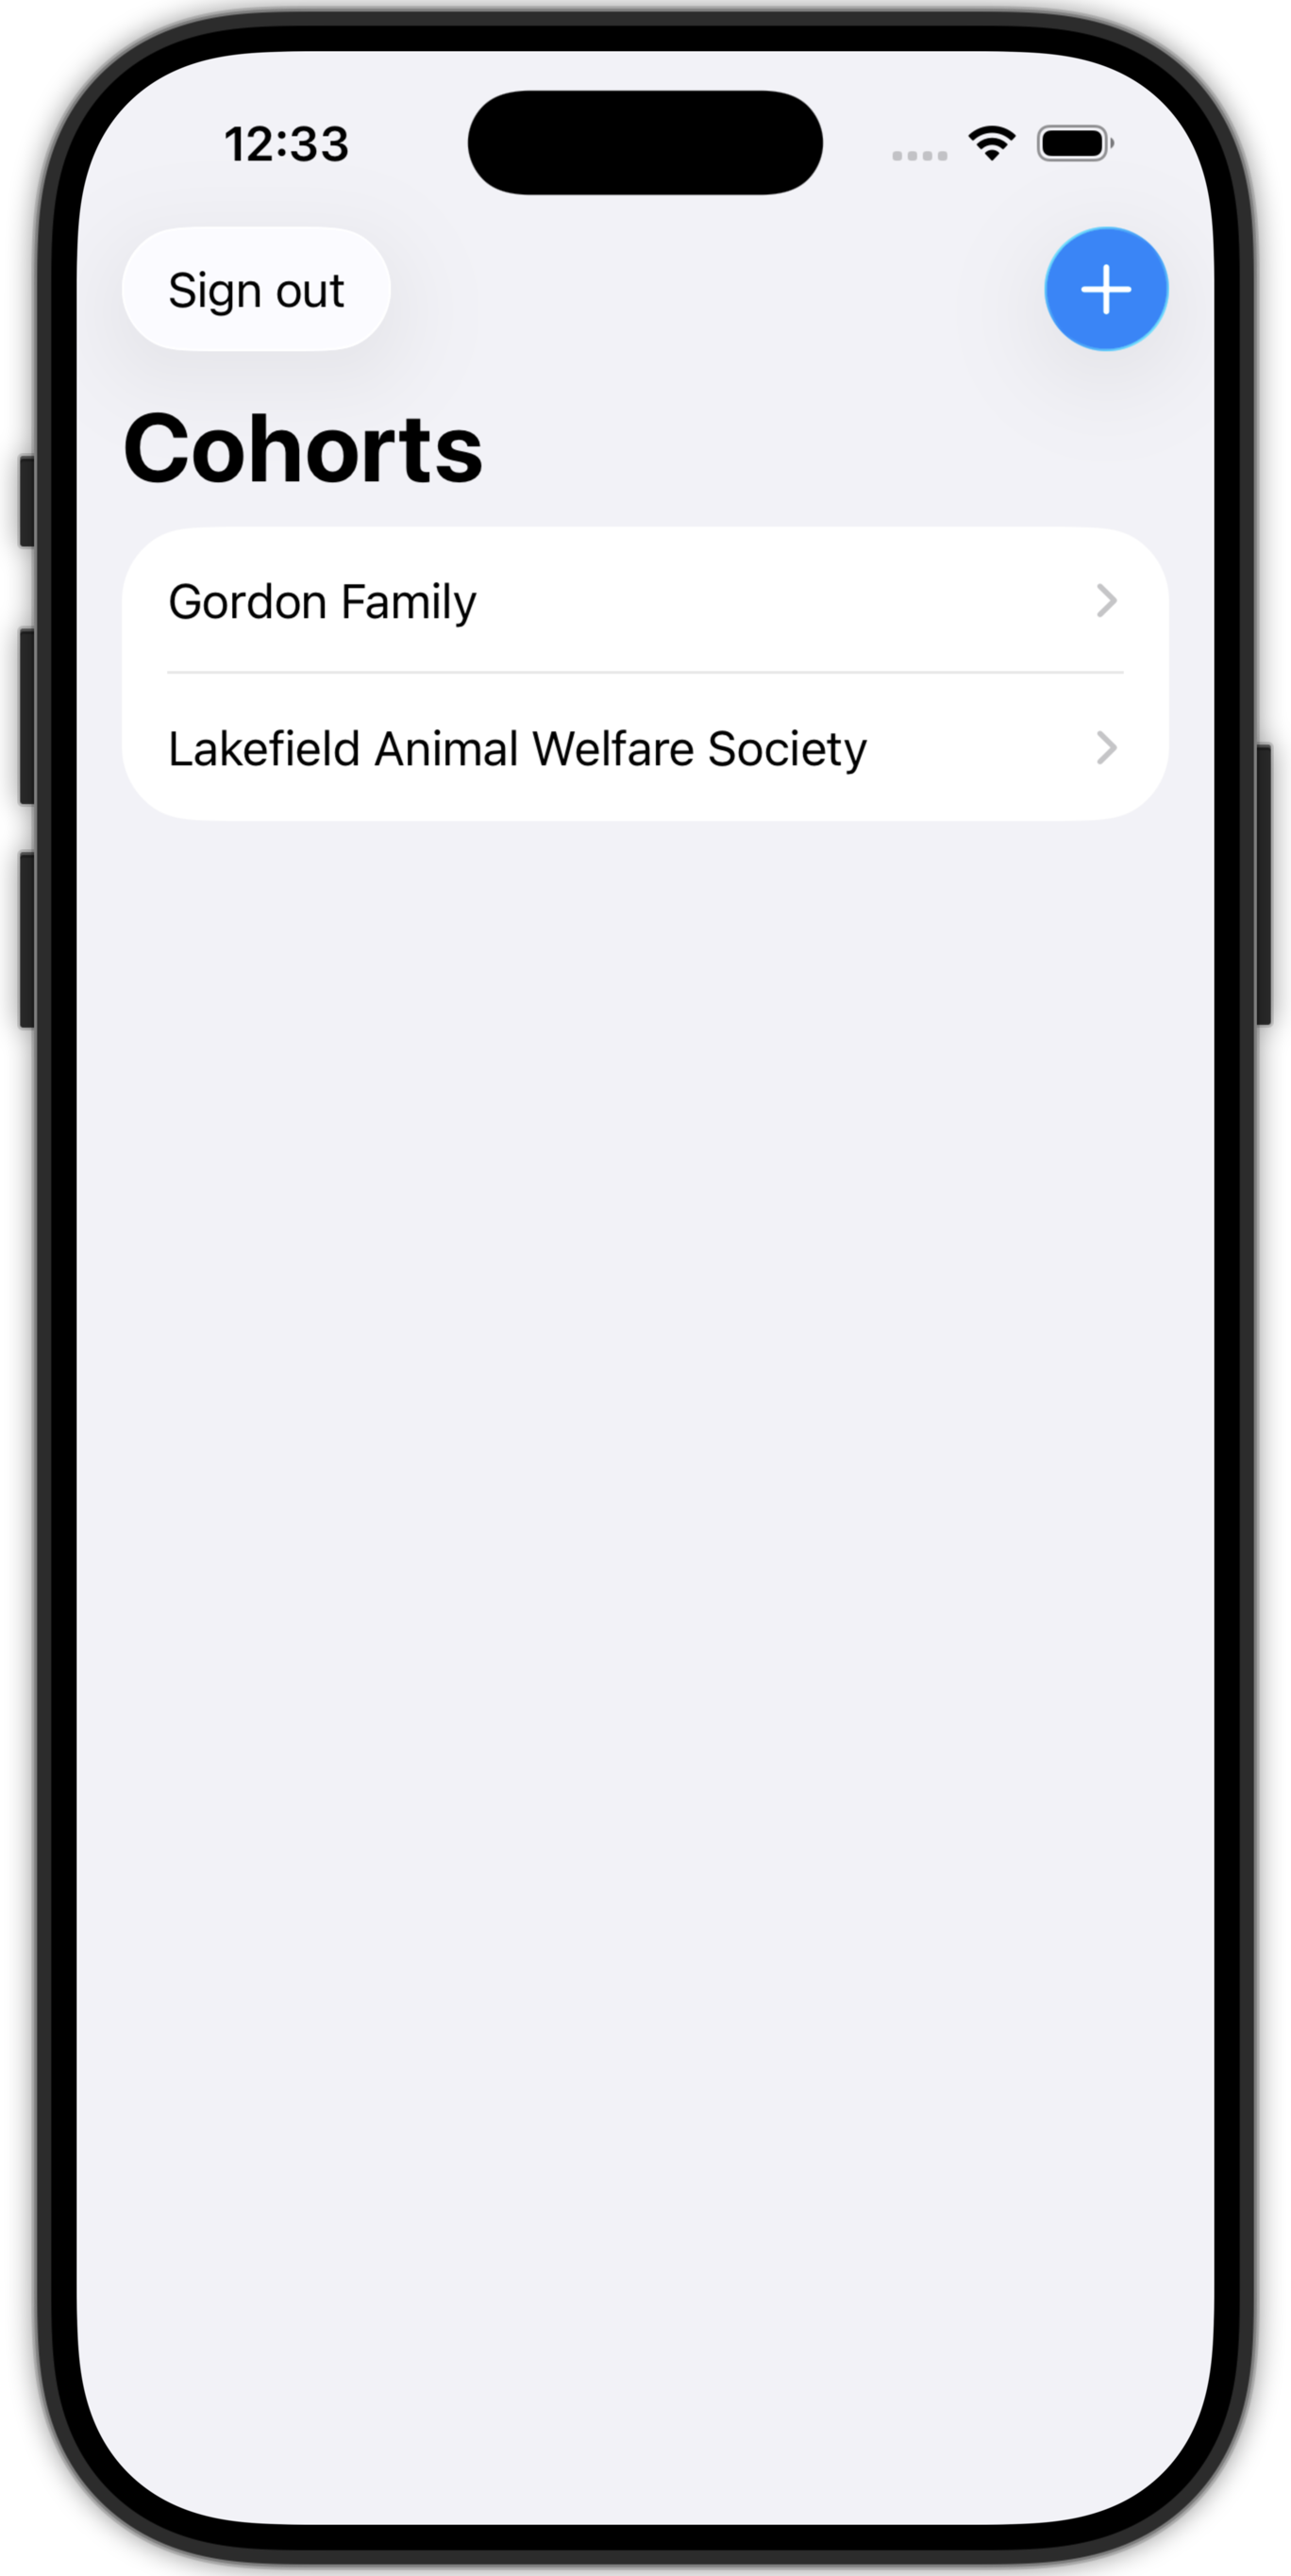
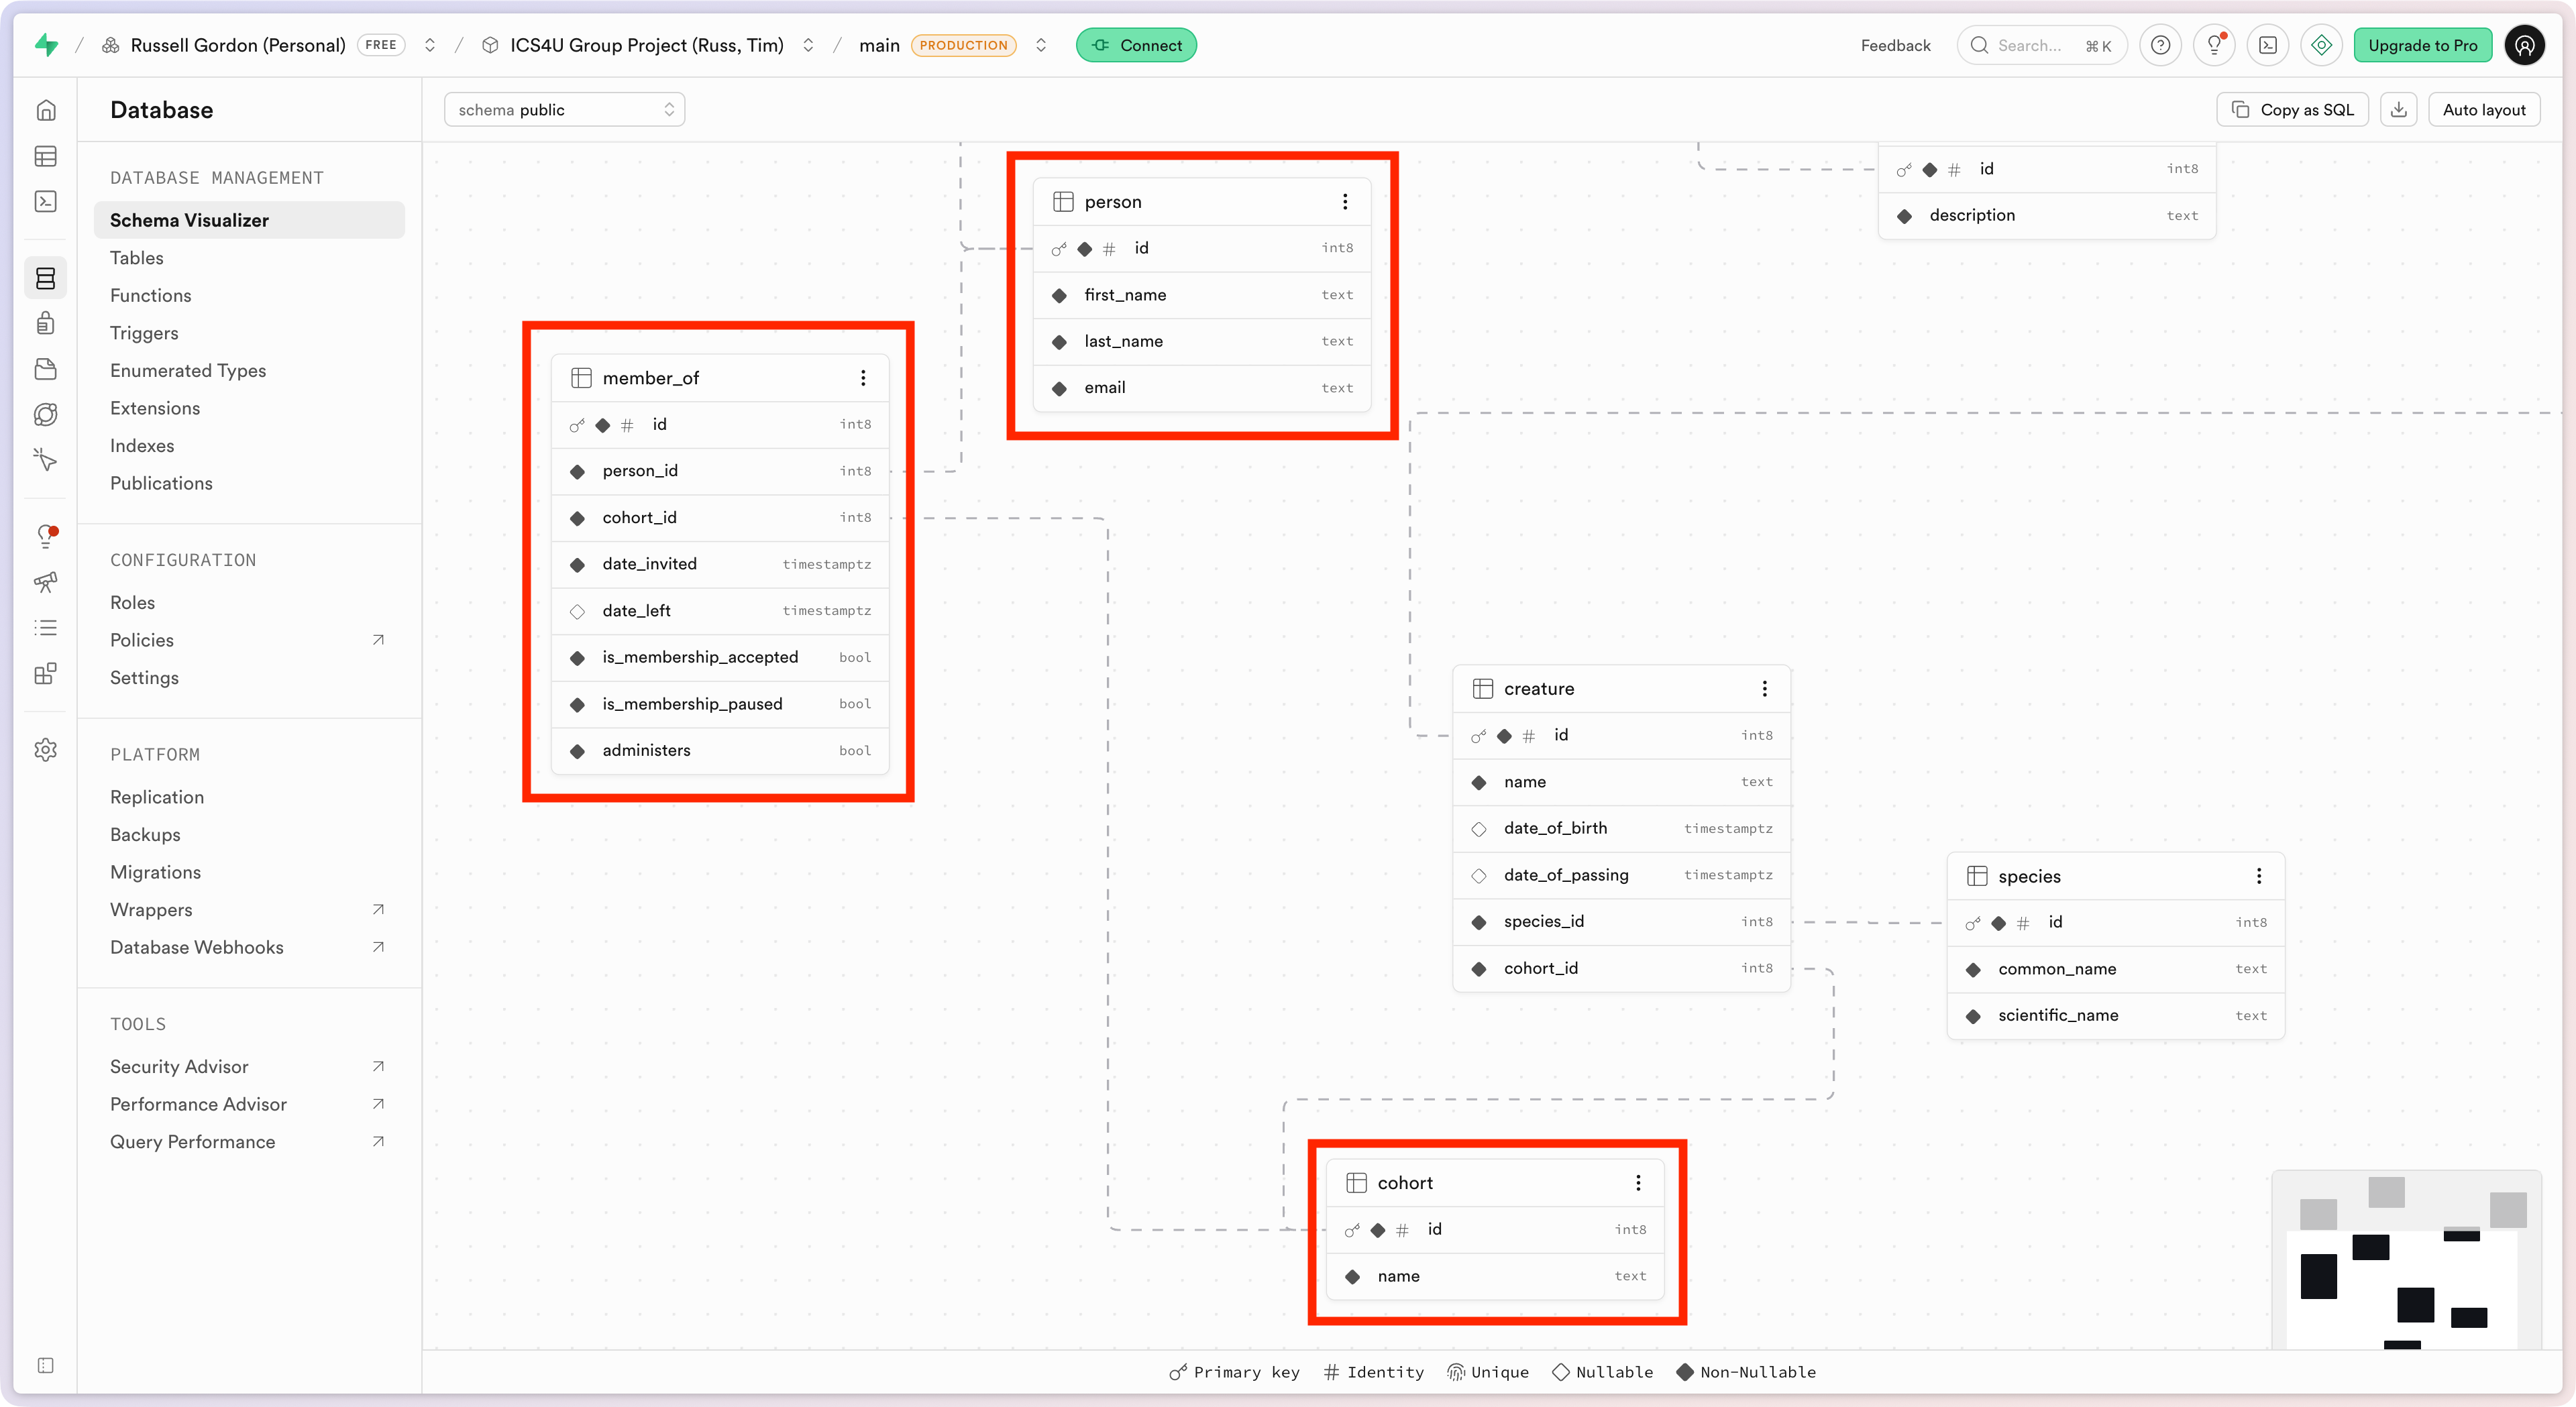
That screen involves data from this portion of the ER diagram:
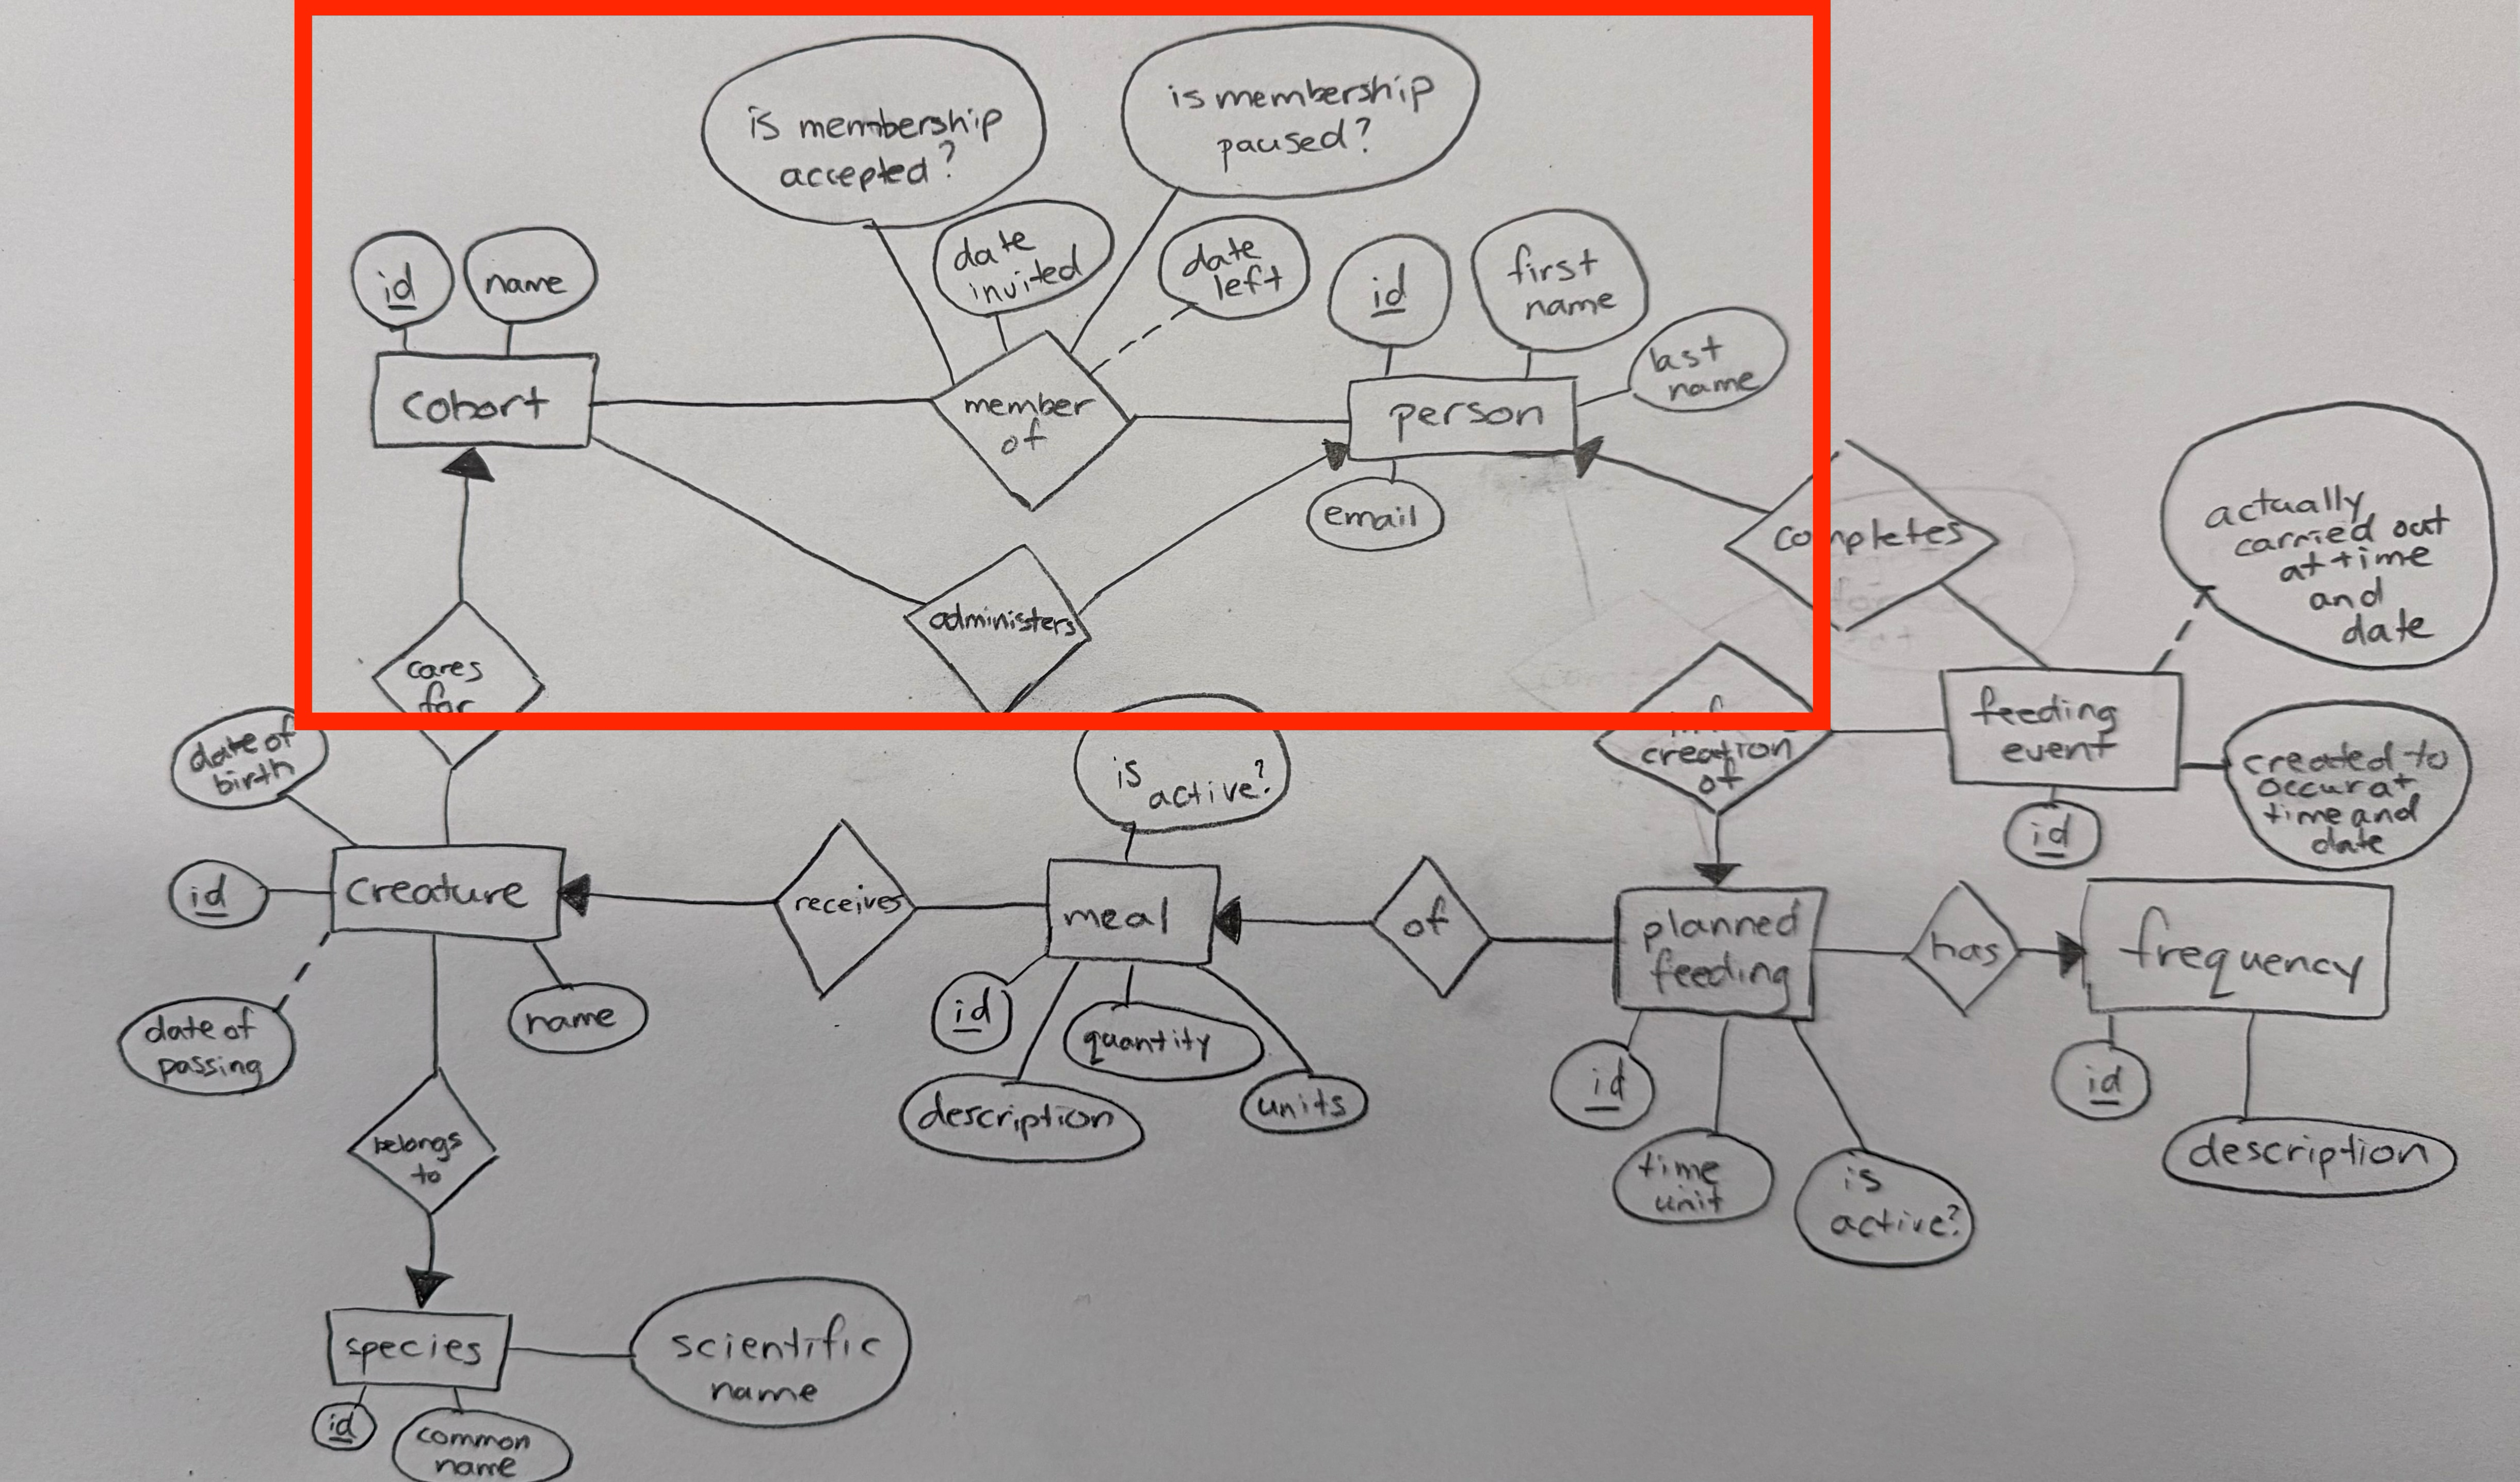
Since the two entities – person and cohort – are connected by a many-to-many relationship, that will involve joining the person table to the member_of table to the cohort table, following the “dotted line” connections shown between the primary key and foreign key columns of each table:
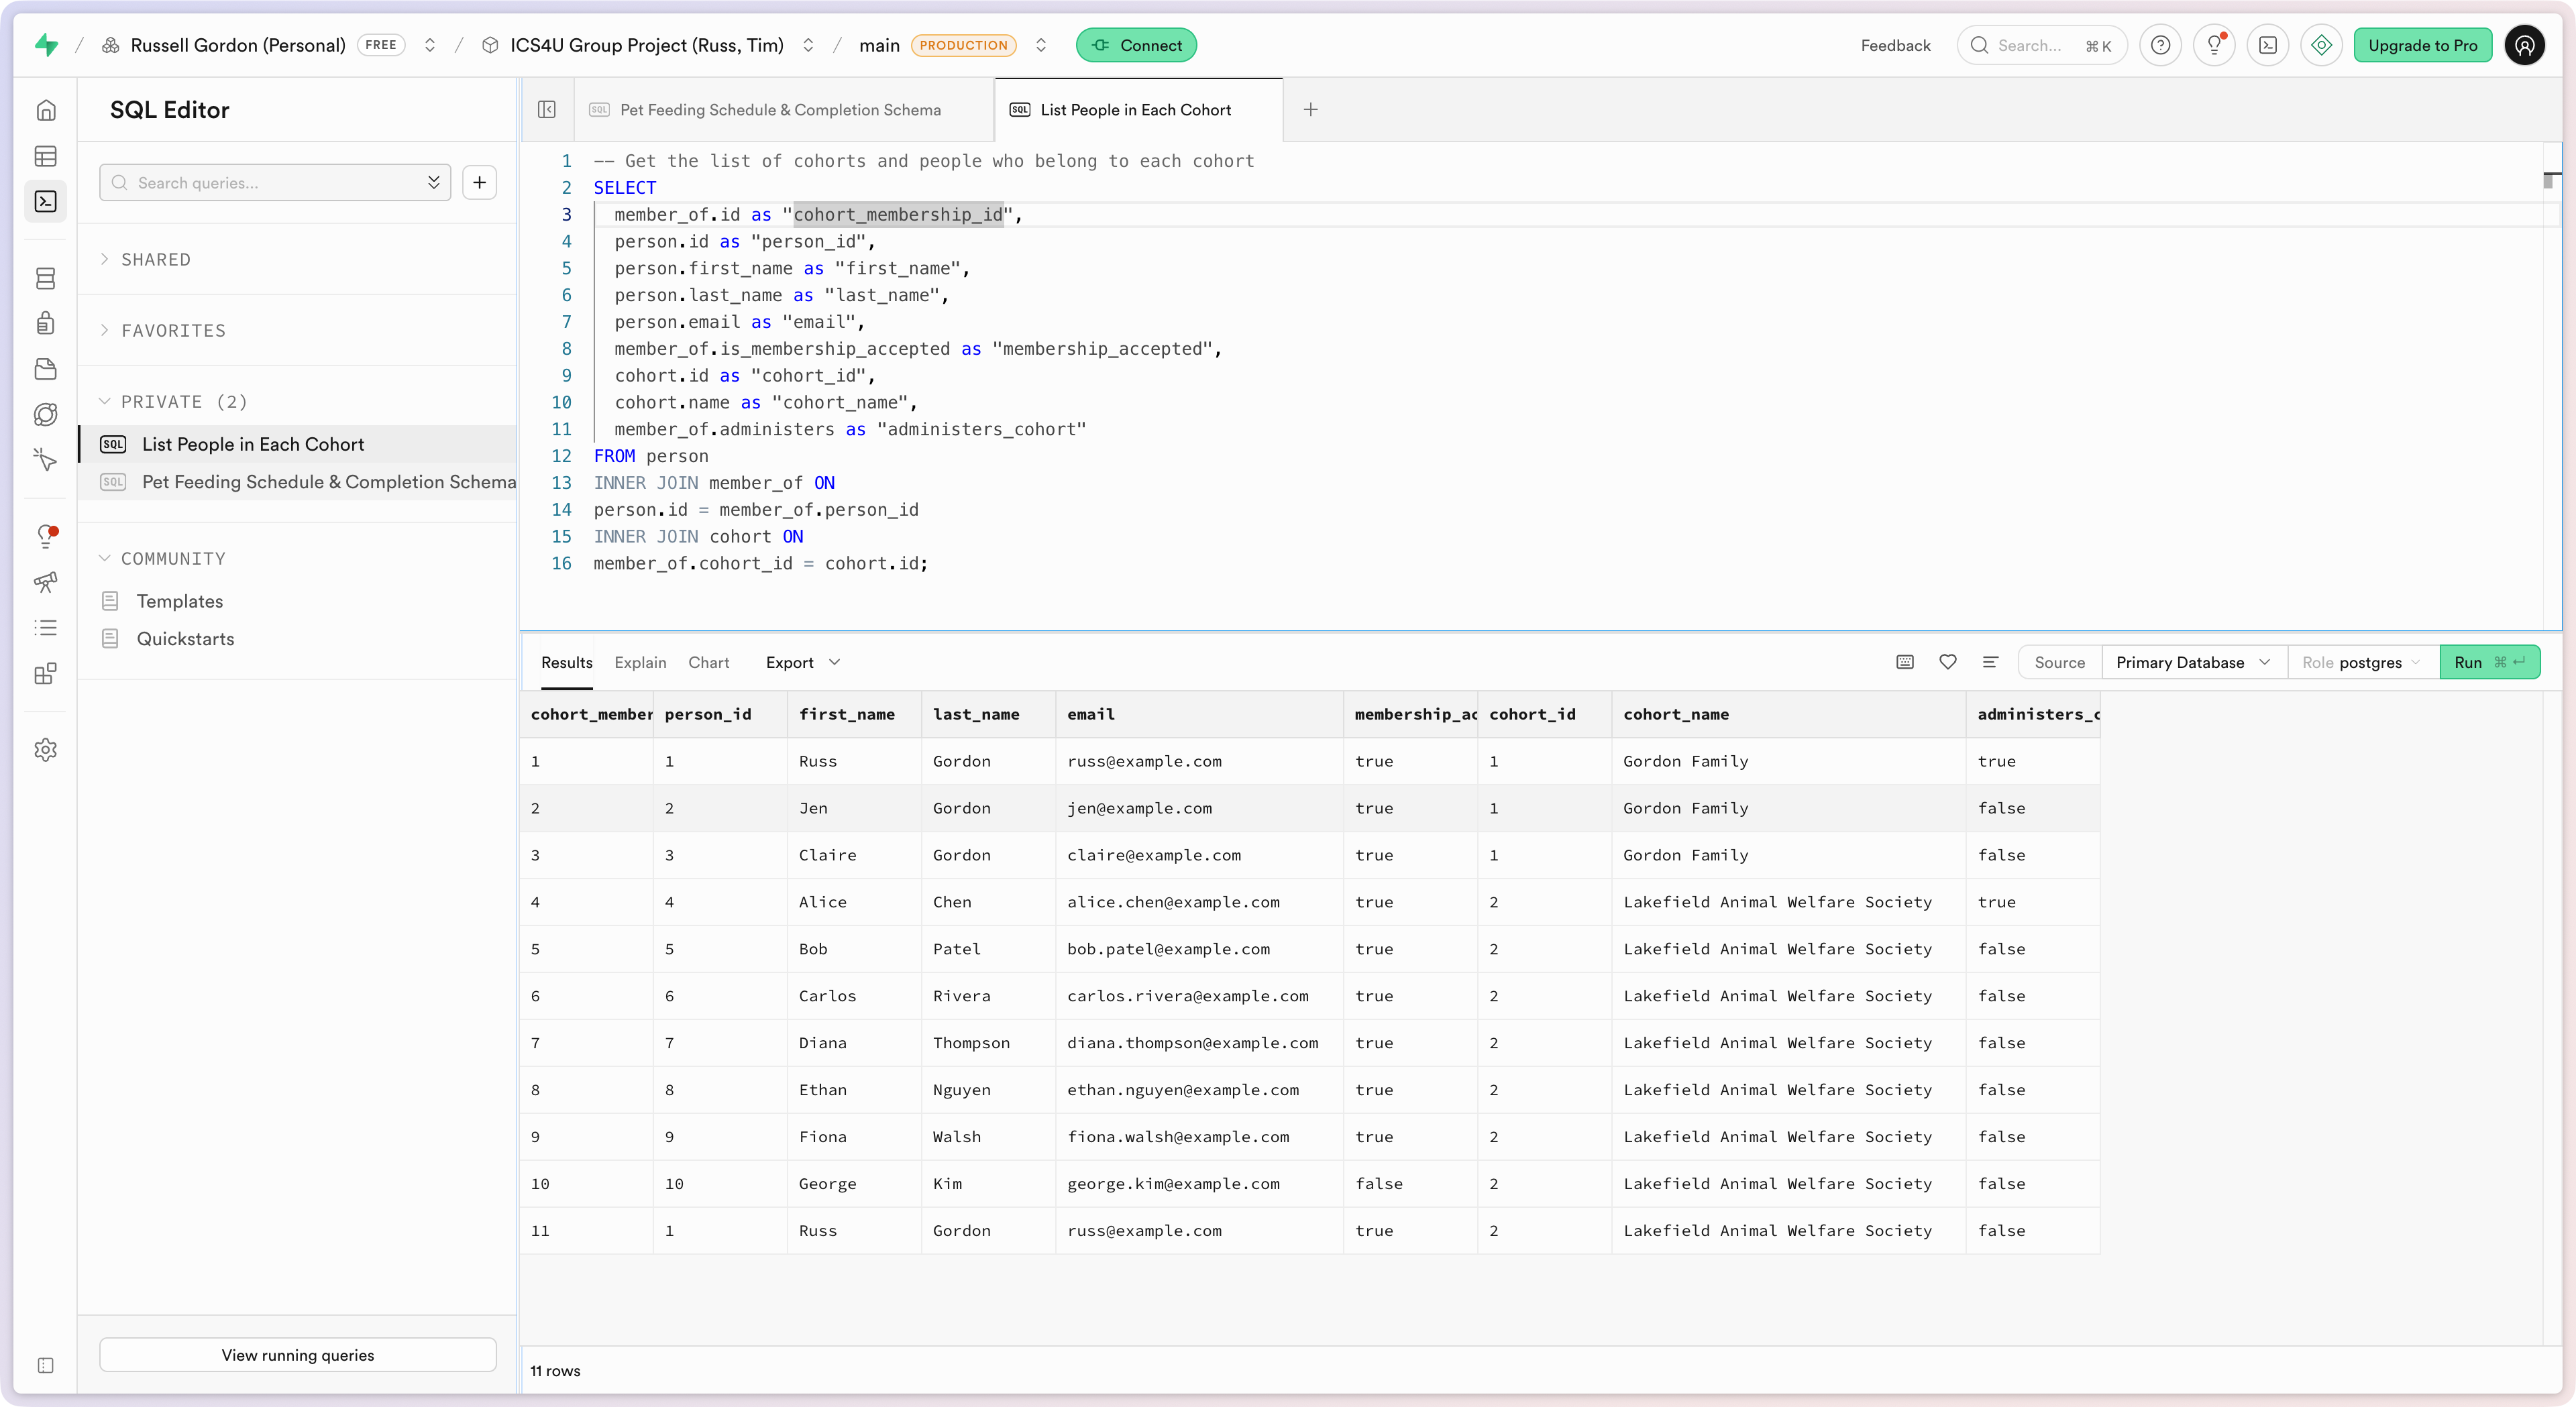
The query looks like this when written:
To create a database view, we add the two lines at the top:
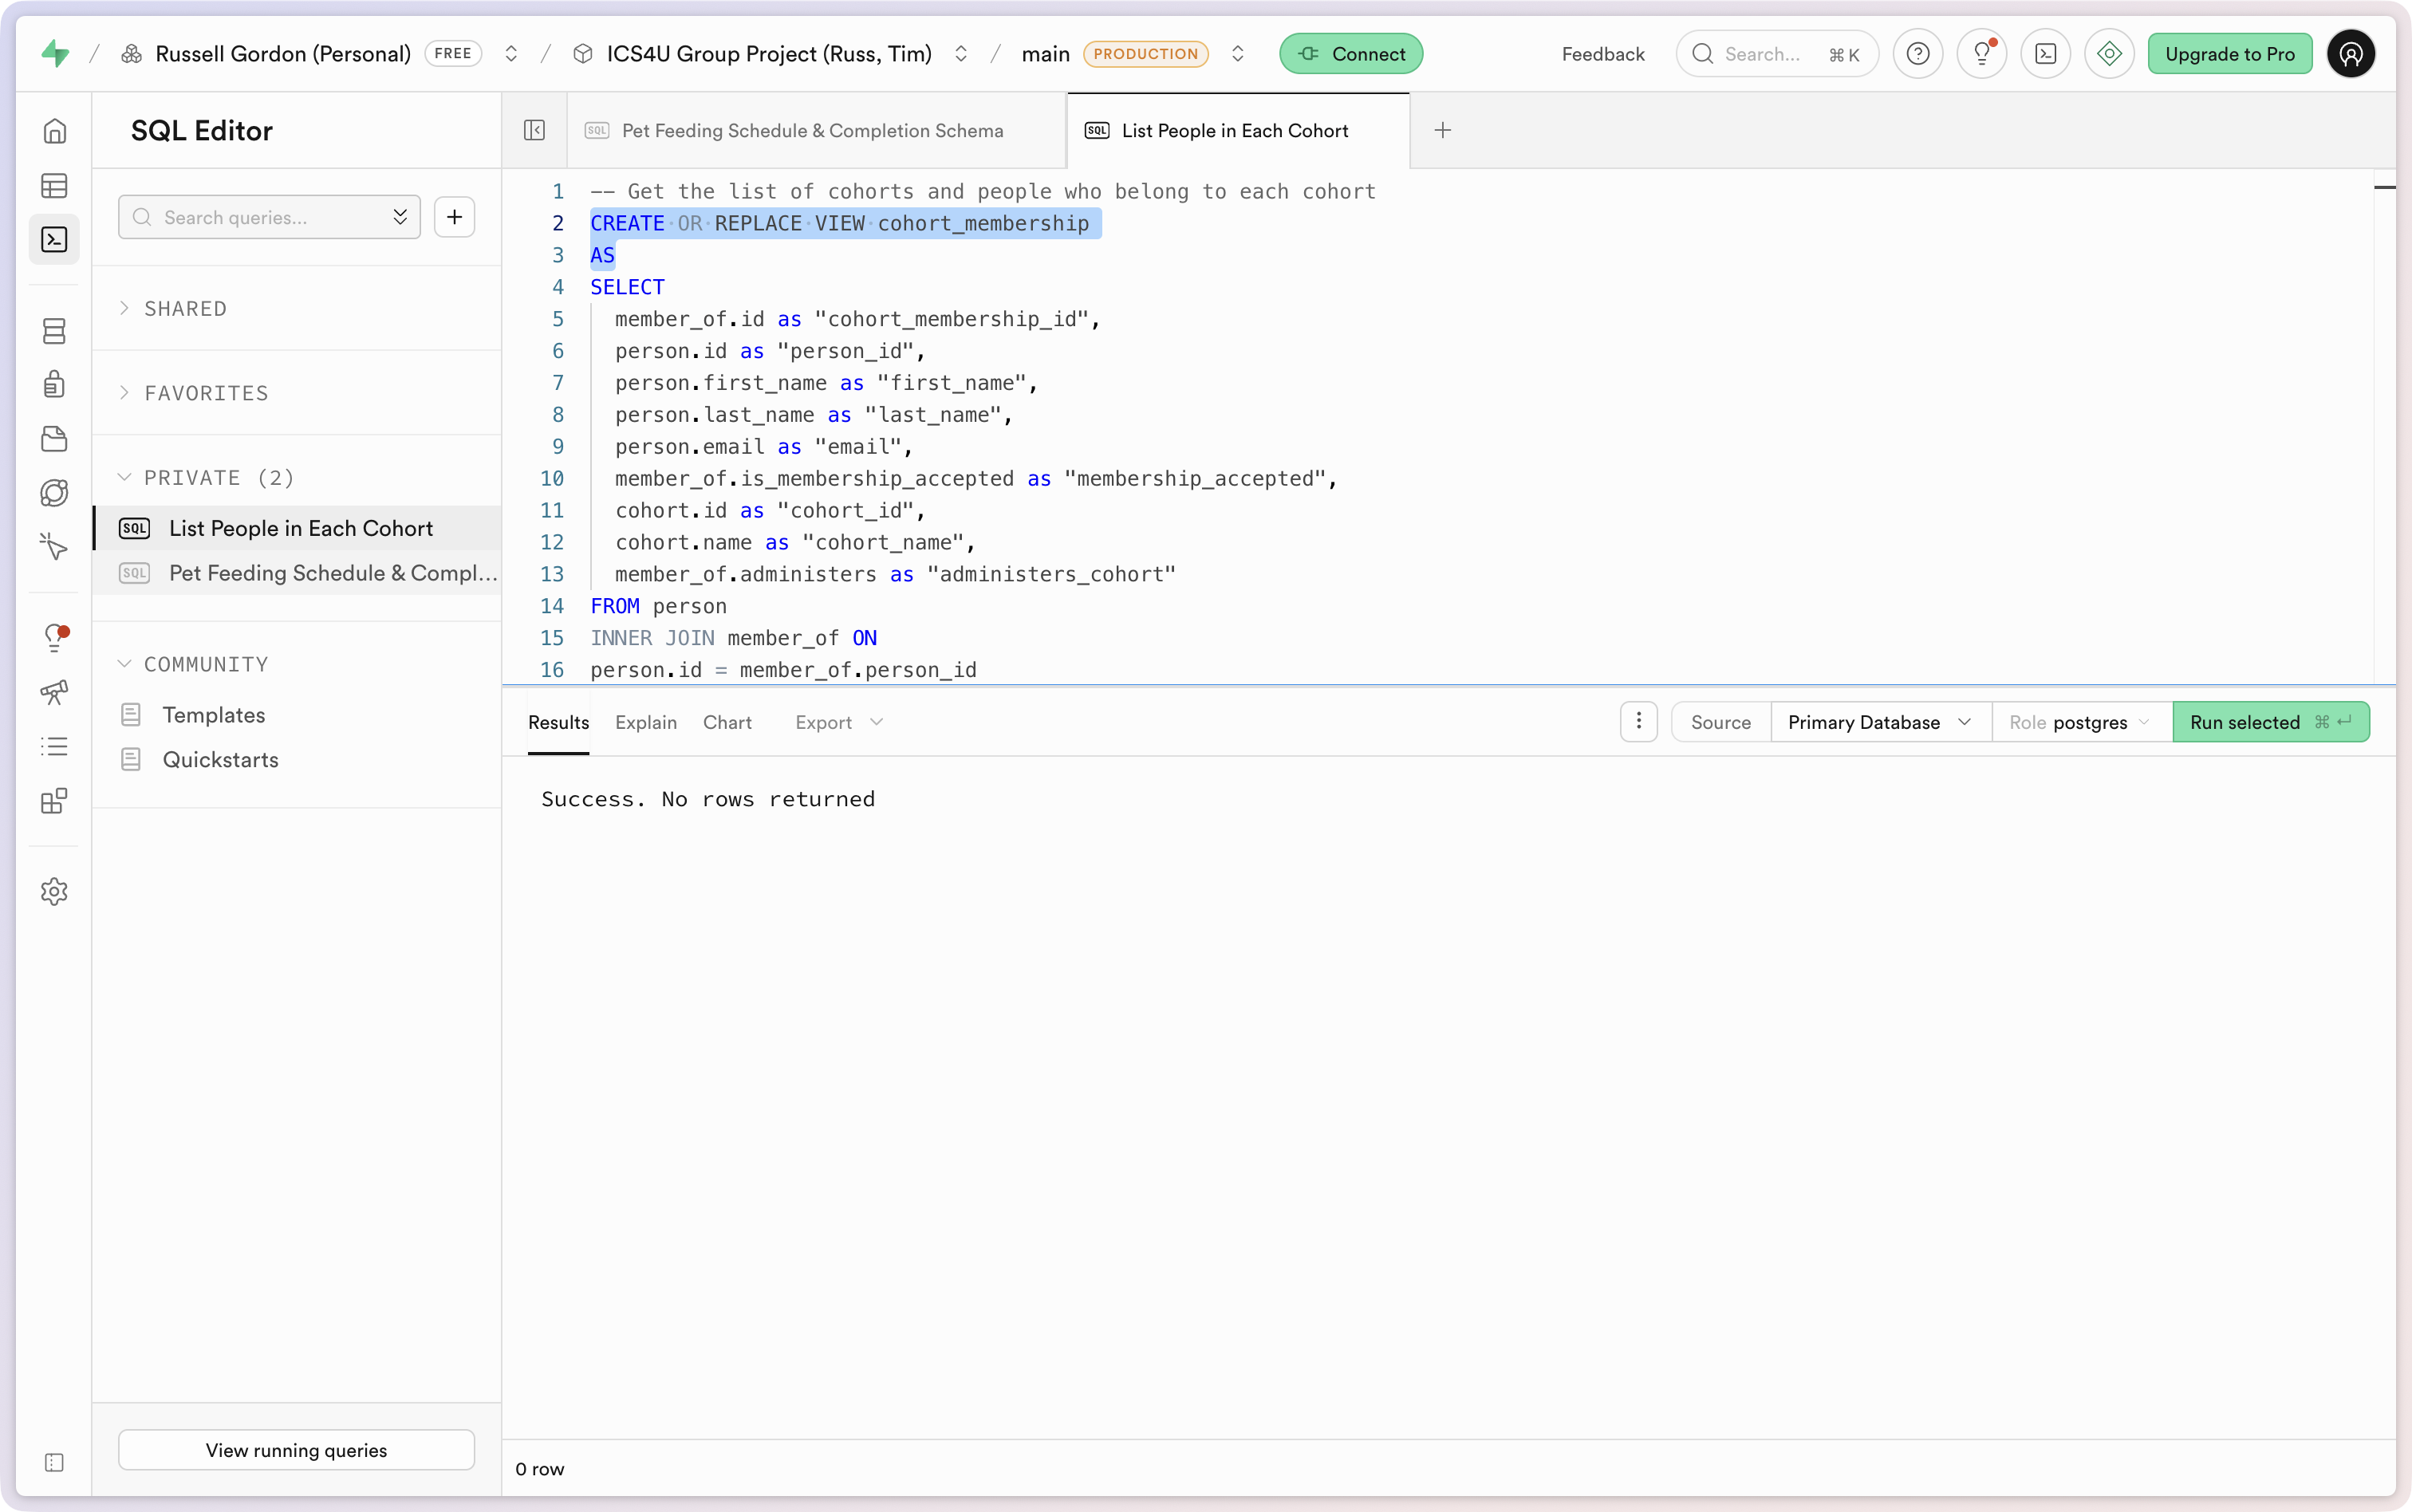
That provides a “pseudo-table” that we can now query from the app:
Create a matching model
The next step is to create a model file whose stored properties match the columns of the database view:
.png)
Add logging
It is exceptionally difficulty to debug logical errors that commonly occur when pulling data from a database without having good log messages appearing in the console of your app when it runs.
TIP
If you really want to dive in to what logging within an app is, watch this 13-minute WWDC video published by Apple:
Again, as our apps grow in complexity, they become harder to debug. We need to know what is happening and when. That is where log messages or logging can help.
The gist of the idea is to sprinkle messages to ourselves (as developers) throughout our app. End users will never see these messages, but they can help us as developers to debug logical errors during the development process, and potentially, to understand what went wrong if we happen to ship an app with a bug to our end-users.
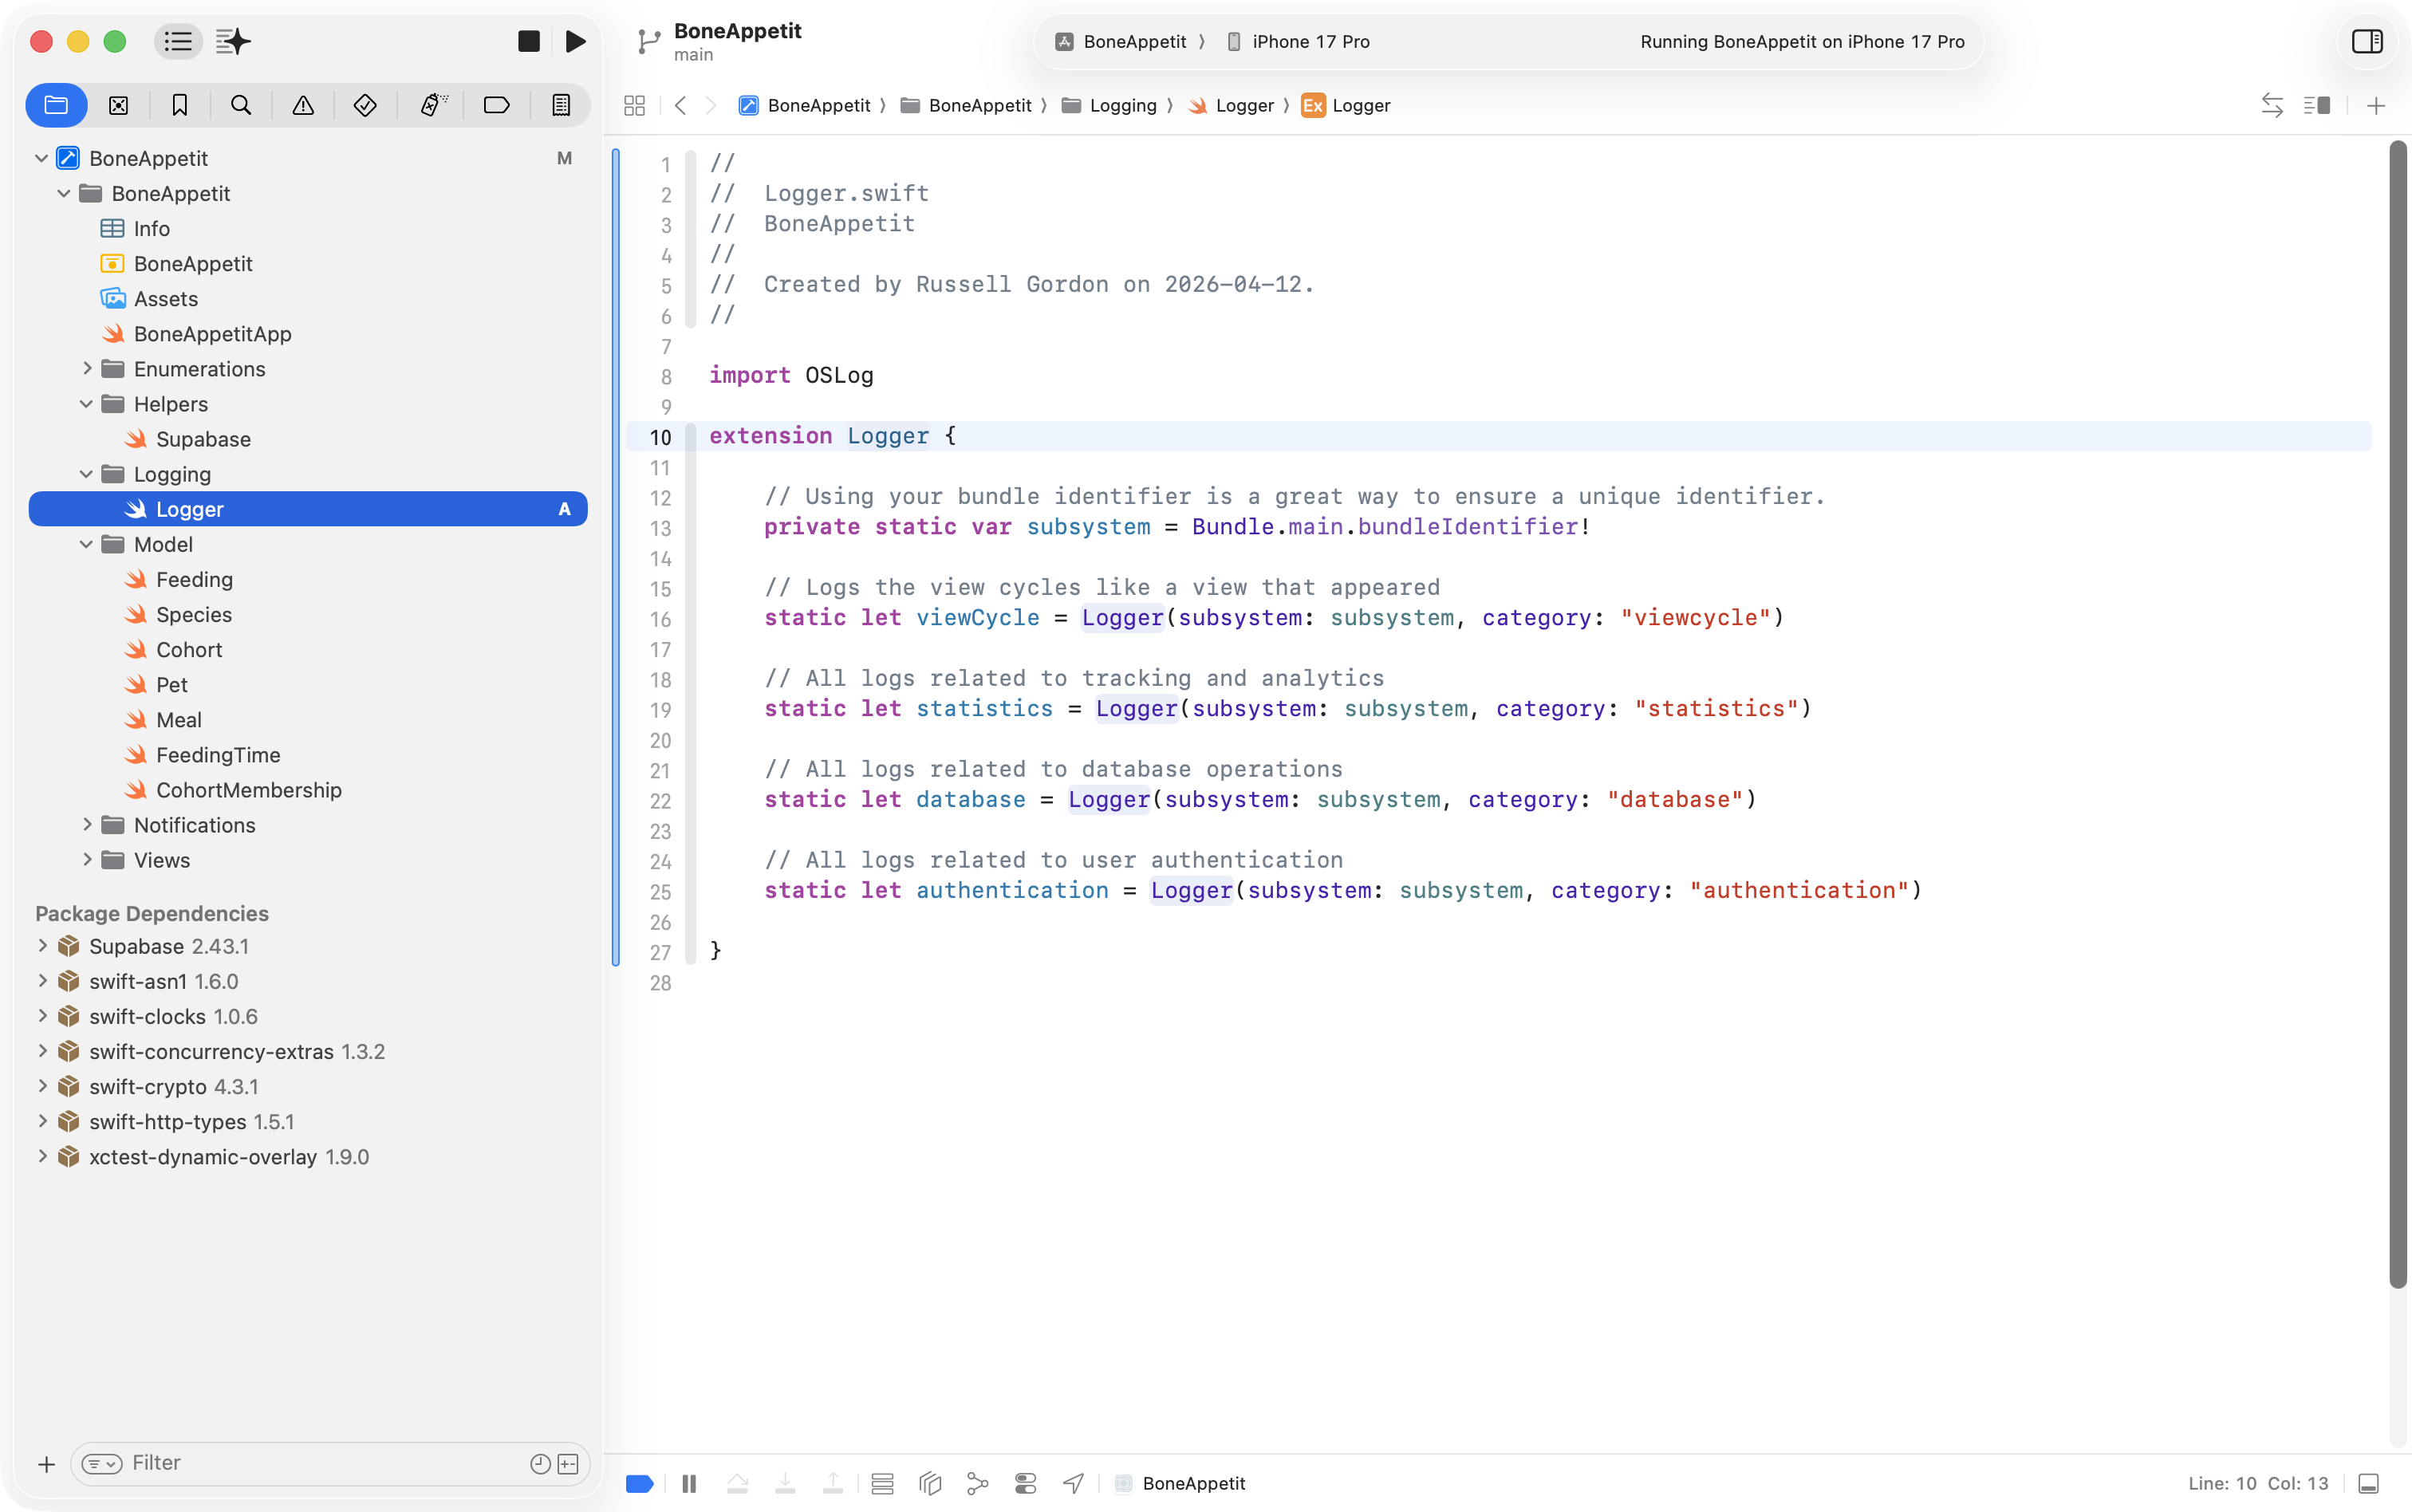
We can organize our log messages into different categories. Let’s start doing this now, by copying this code:
import OSLog

extension Logger {

    // Using your bundle identifier is a great way to ensure a unique identifier.
    private static var subsystem = Bundle.main.bundleIdentifier!

    // Logs the view cycles like a view that appeared
    static let viewCycle = Logger(subsystem: subsystem, category: "viewcycle")

    // All logs related to tracking and analytics
    static let statistics = Logger(subsystem: subsystem, category: "statistics")

    // All logs related to database operations
    static let database = Logger(subsystem: subsystem, category: "database")

    // All logs related to user authentication
    static let authentication = Logger(subsystem: subsystem, category: "authentication")

}
… to a file named Logger.swift in a group named Logging, like this:
What this allows us to do is record log messages but keep track of them within different categories. More on that in a moment.
Create a view model
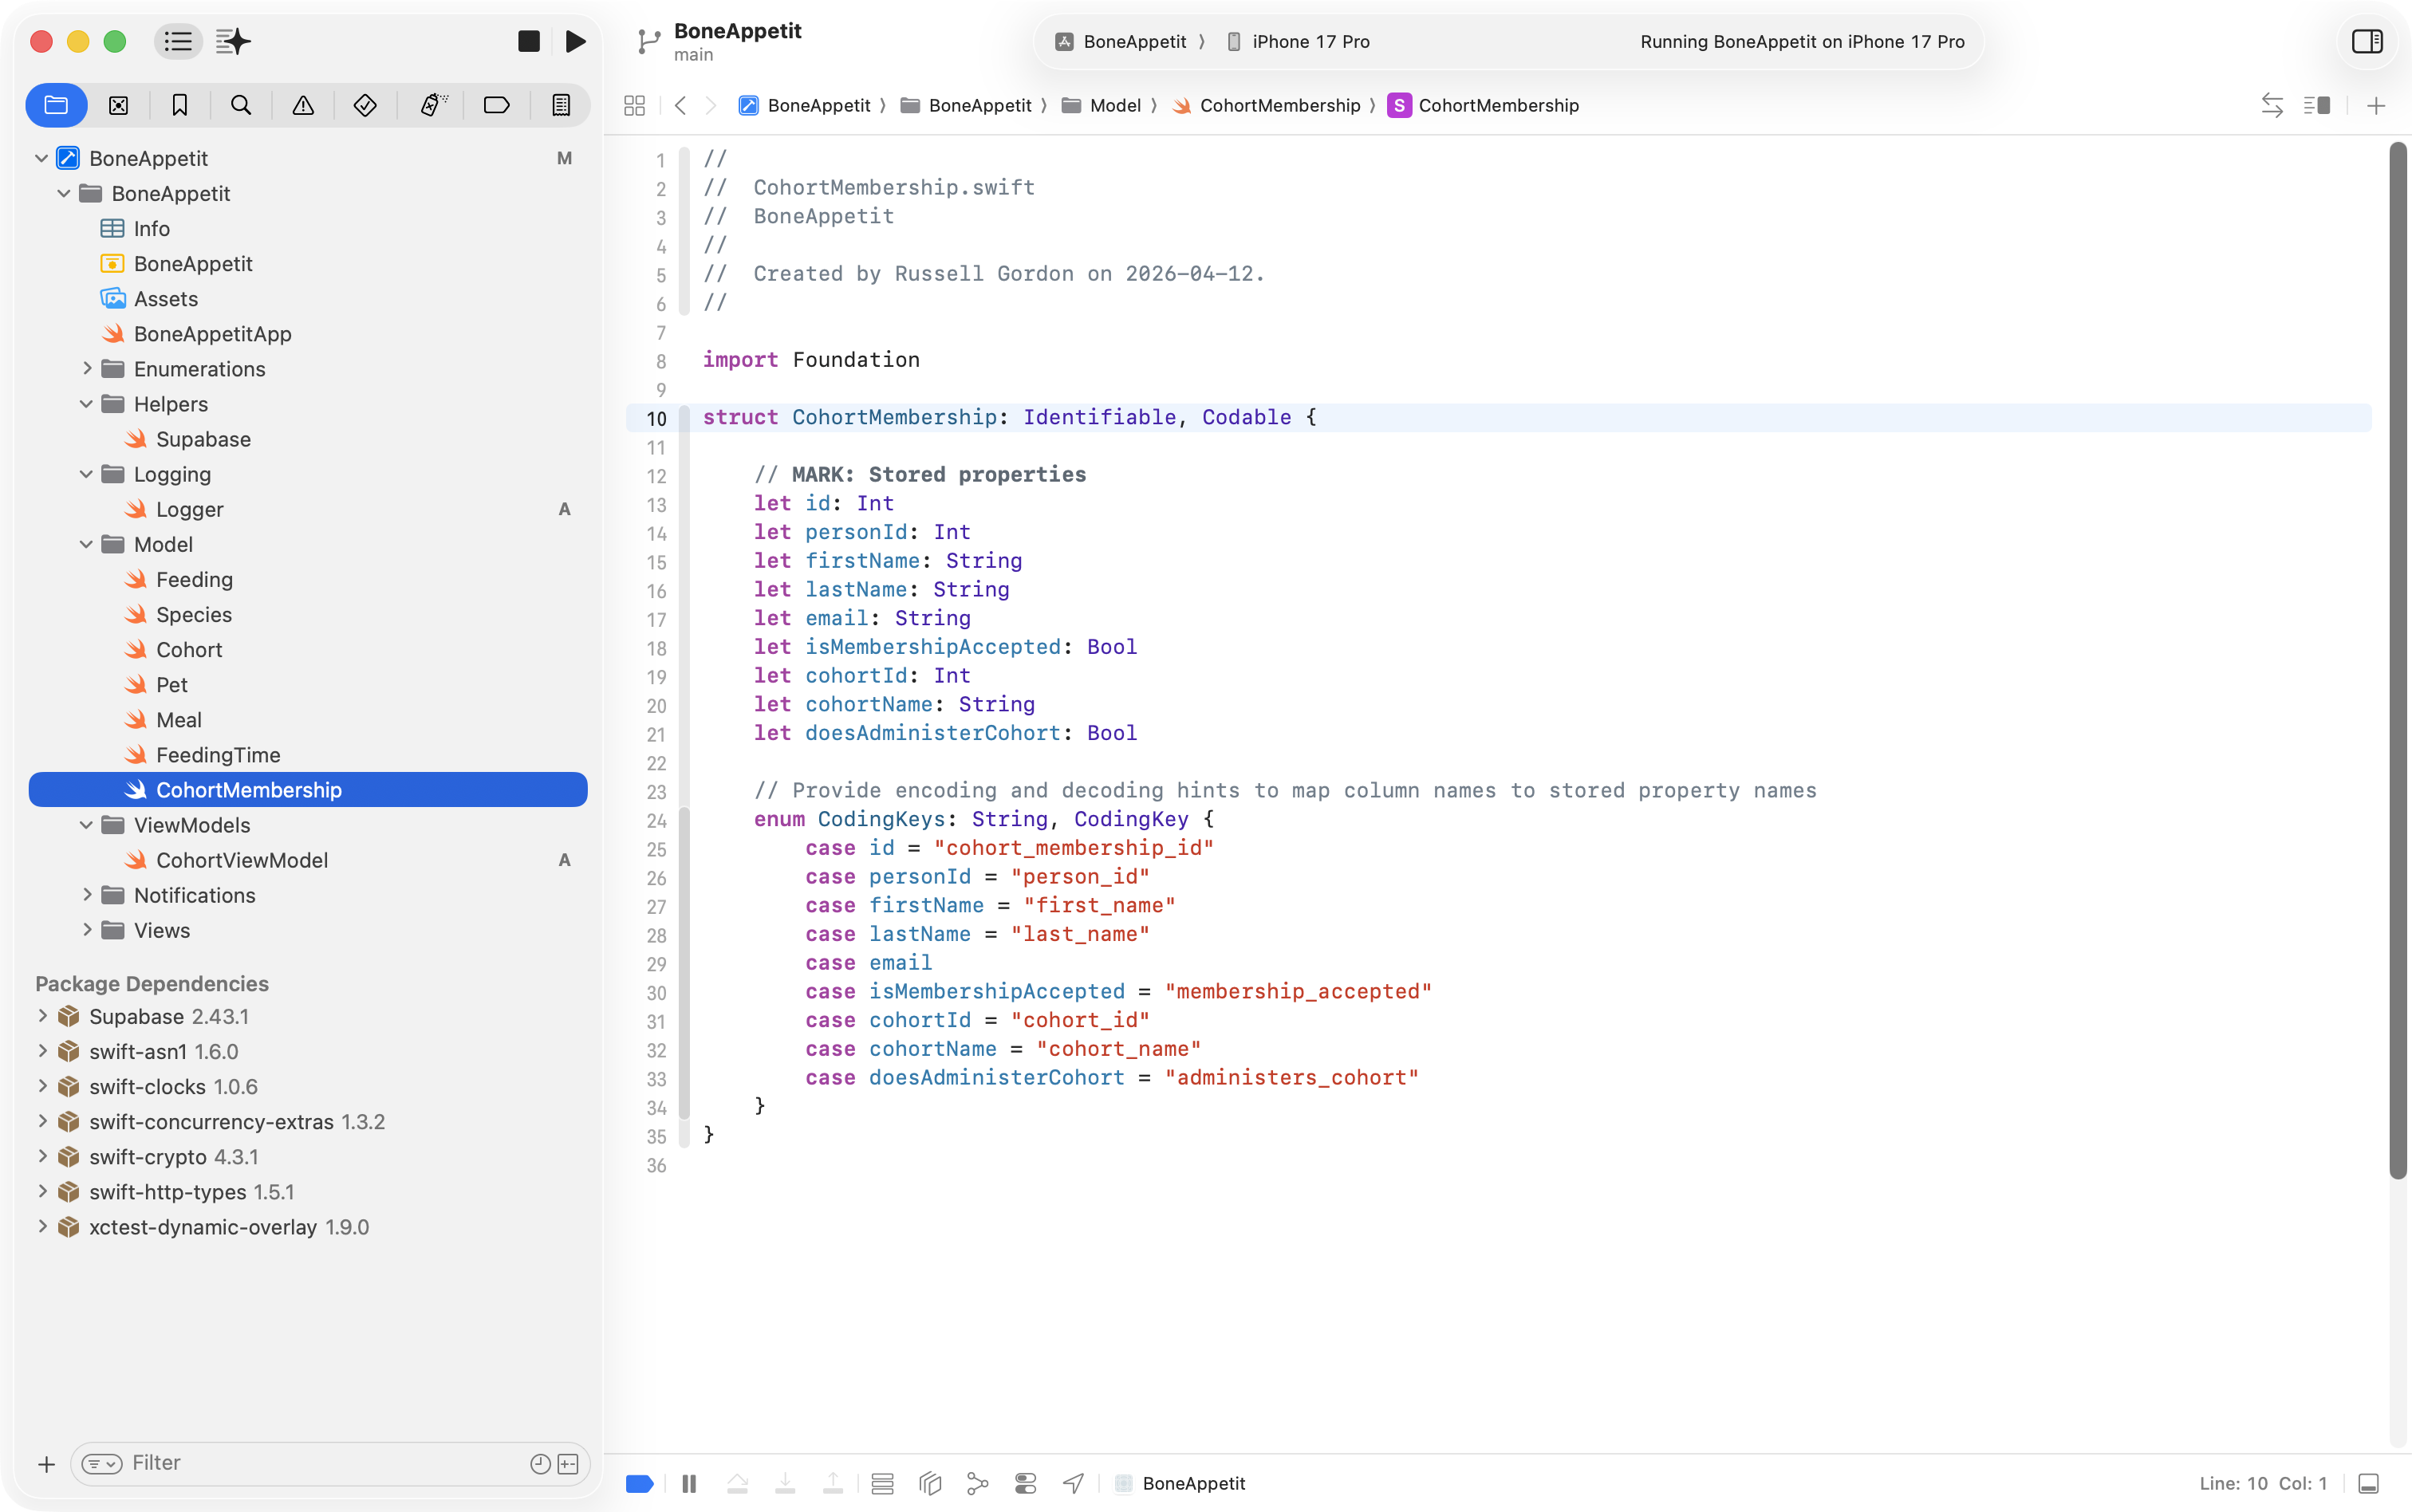
Next we need to author a view model that will pull data from the database view authored earlier. Each row from the database view:
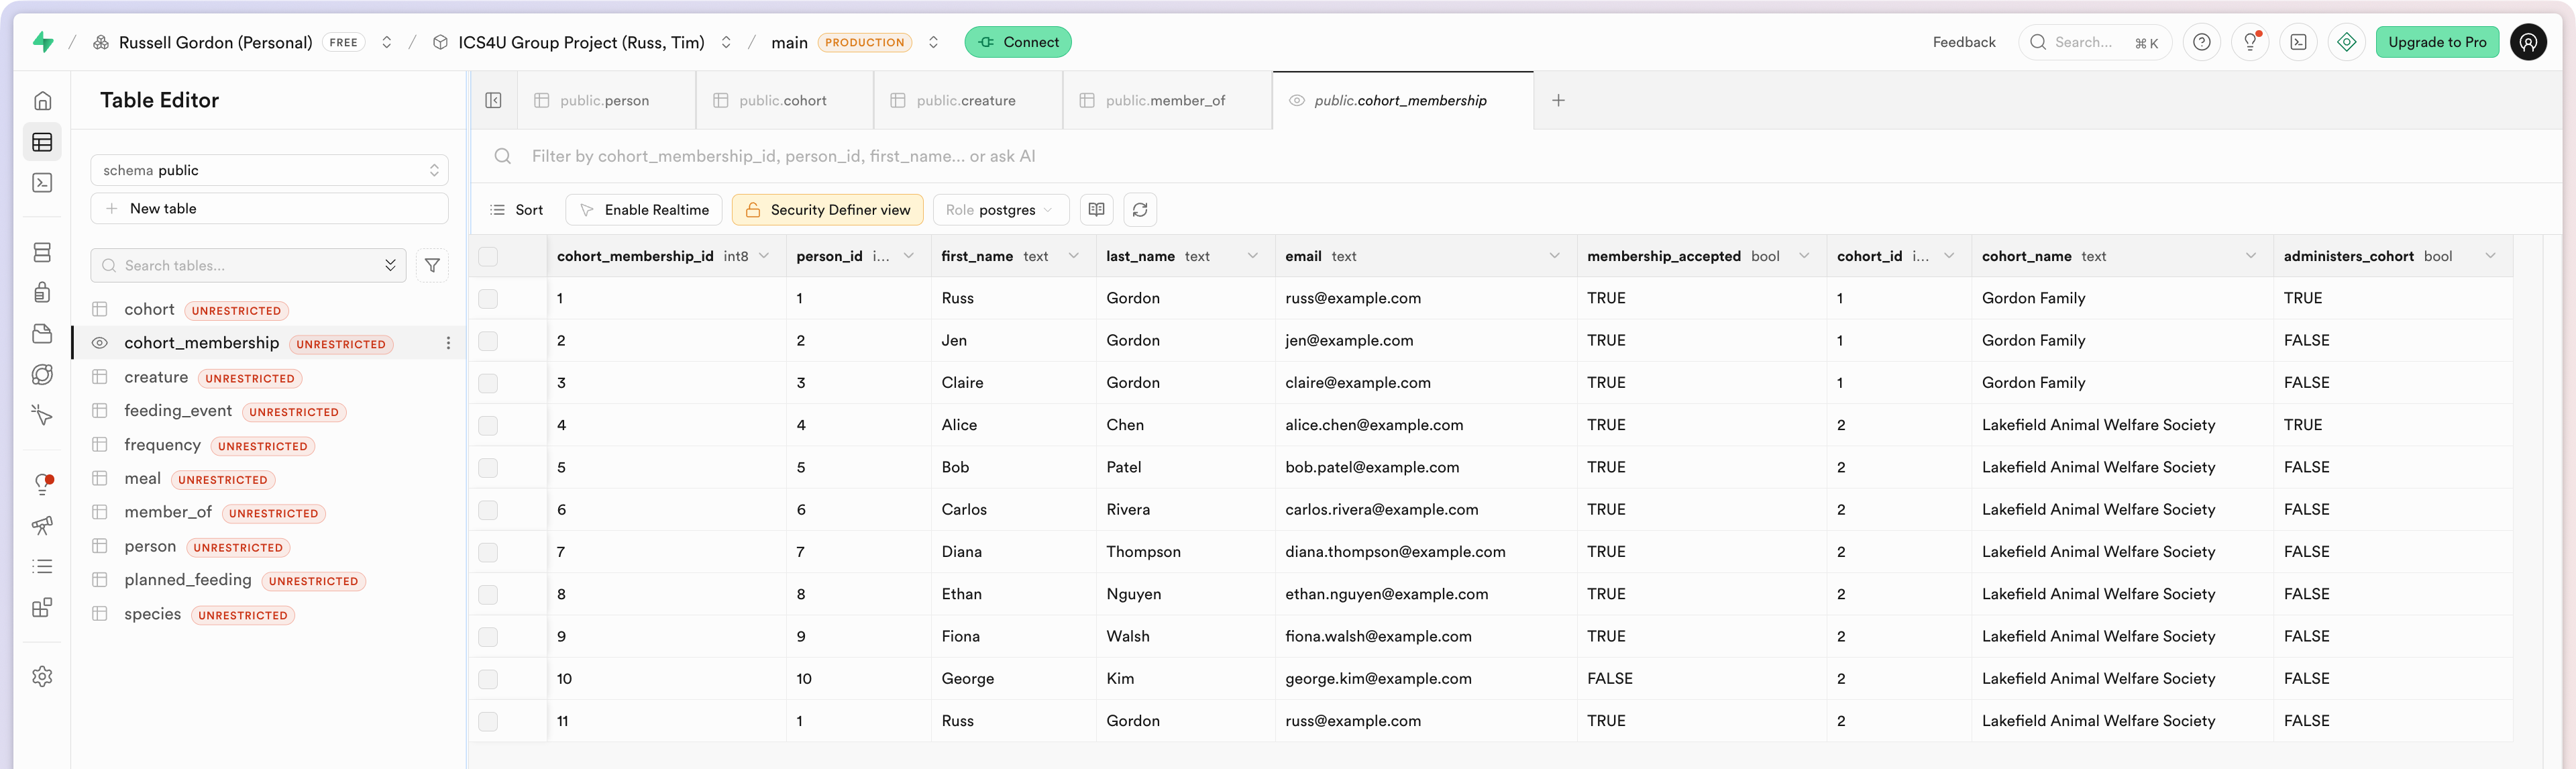
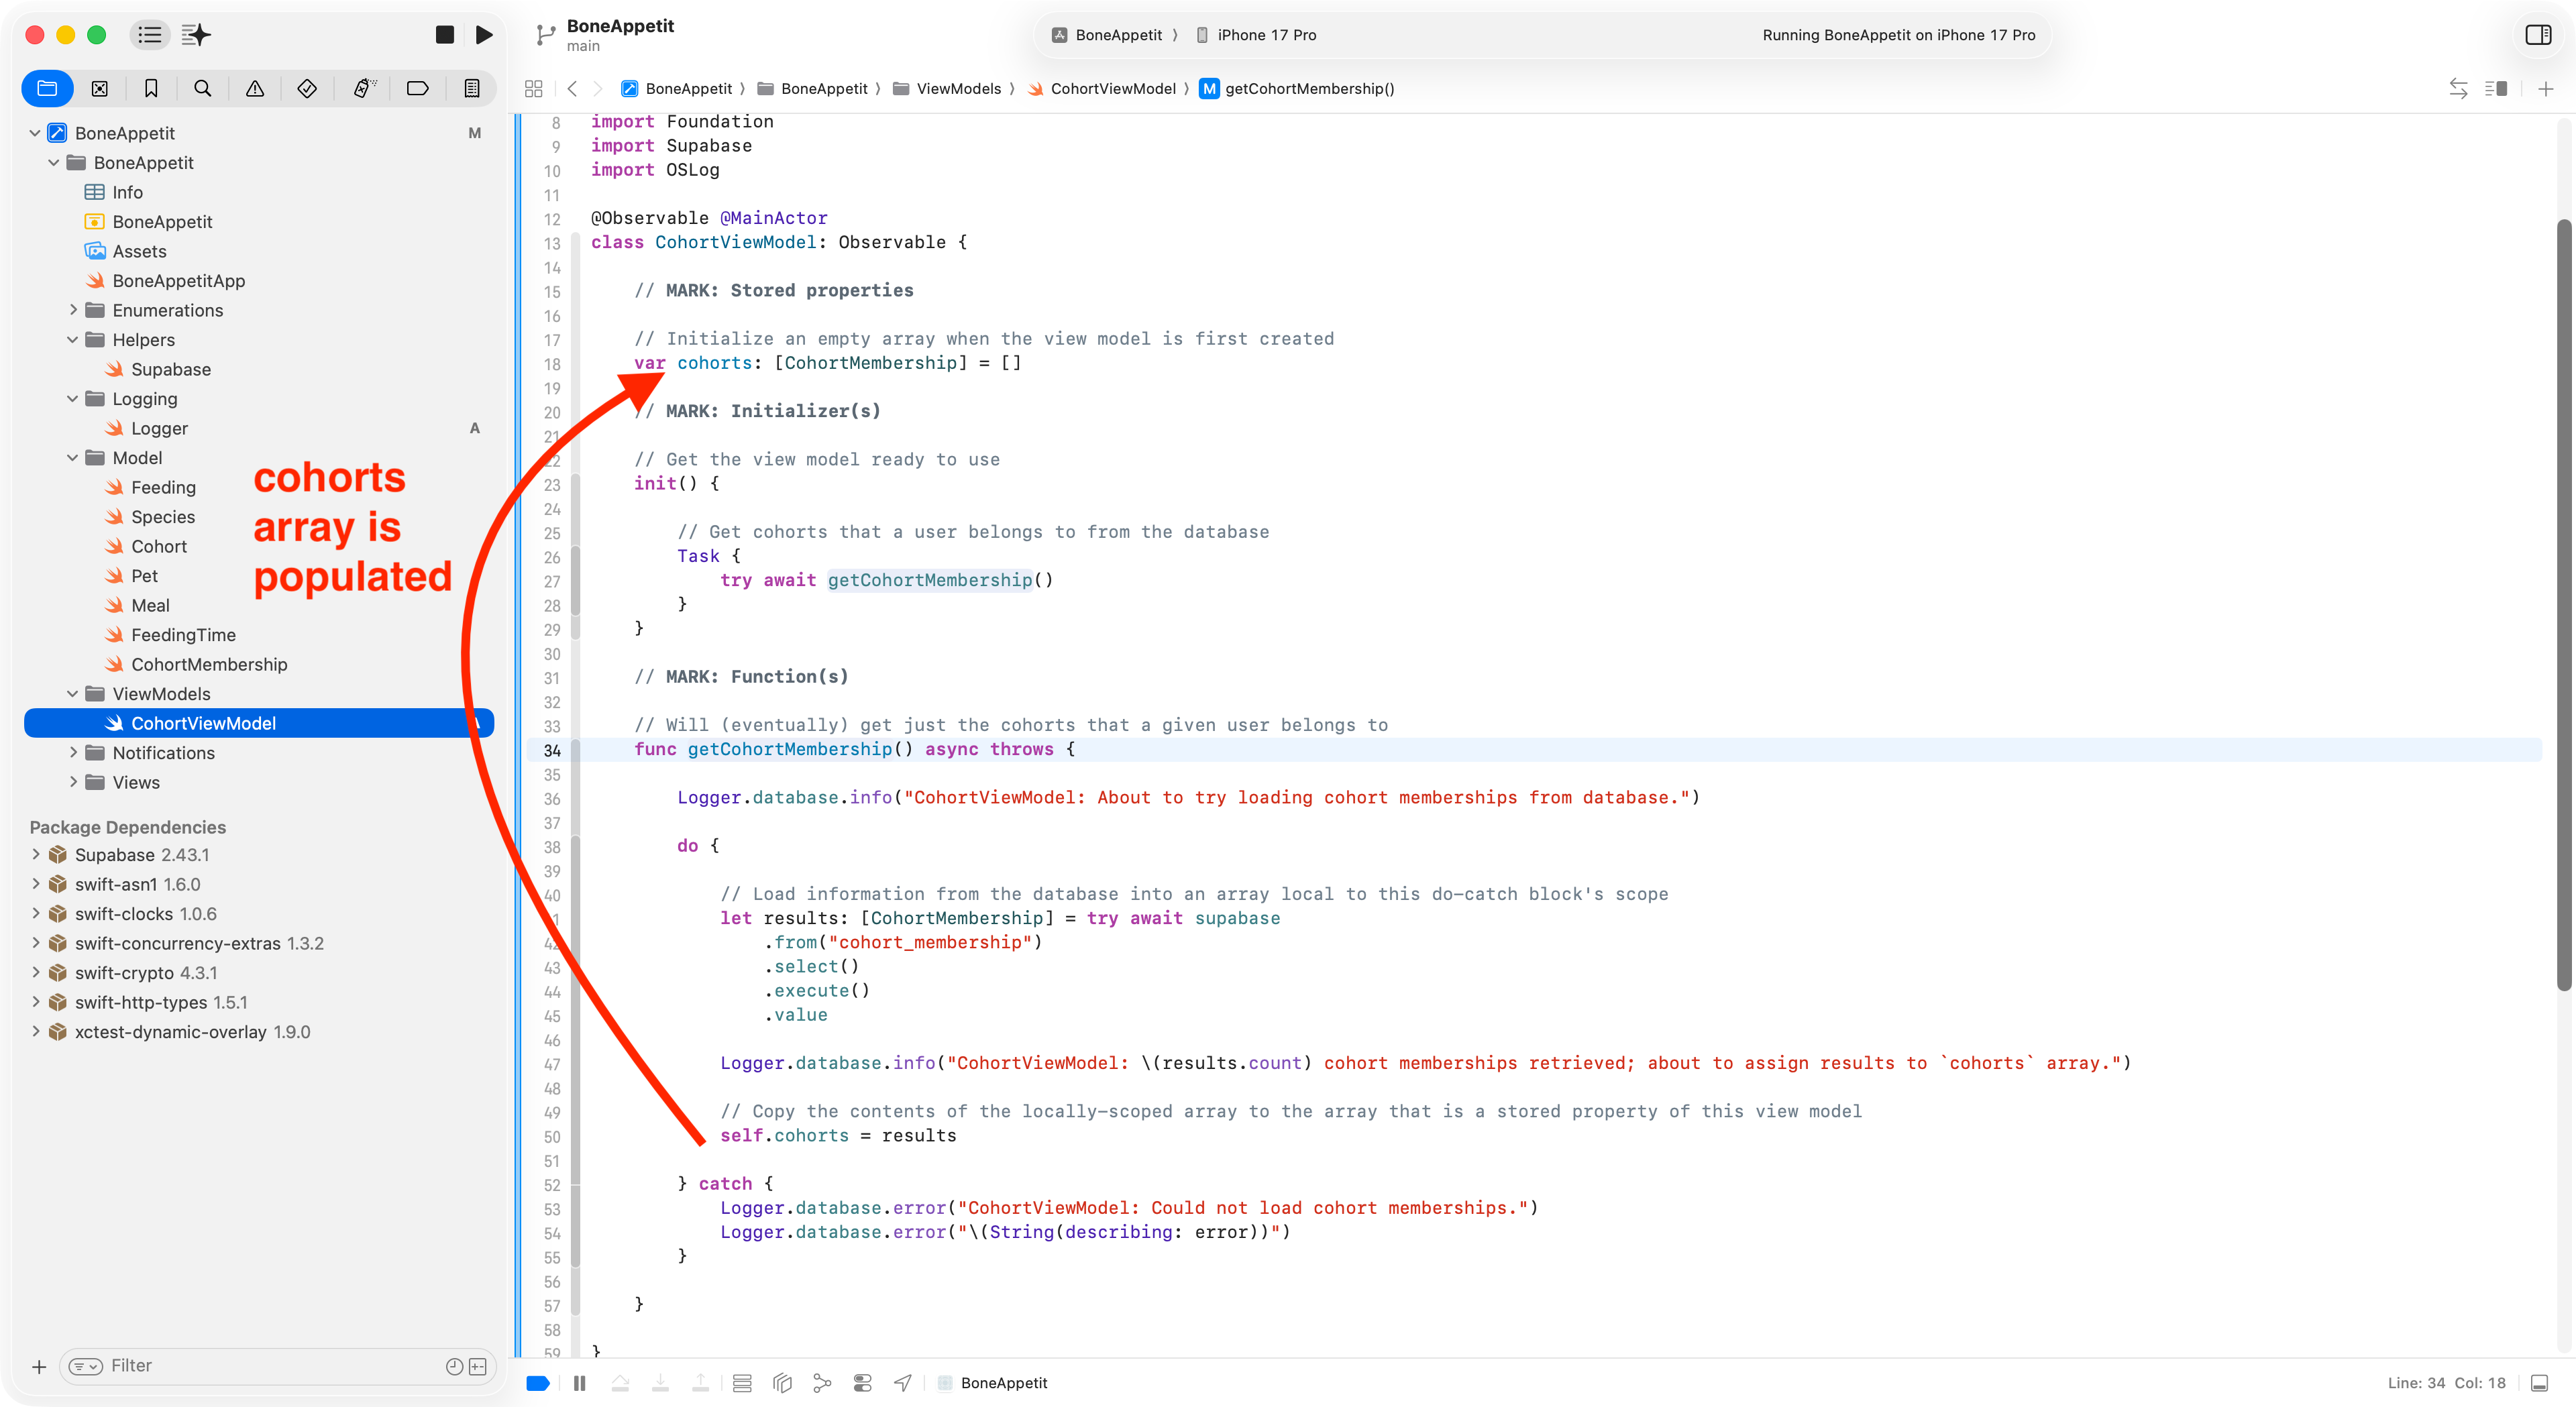
… will be placed in an instance of the CohortMembership type:
… and in turn will populate an array in the view model:
Use the view model
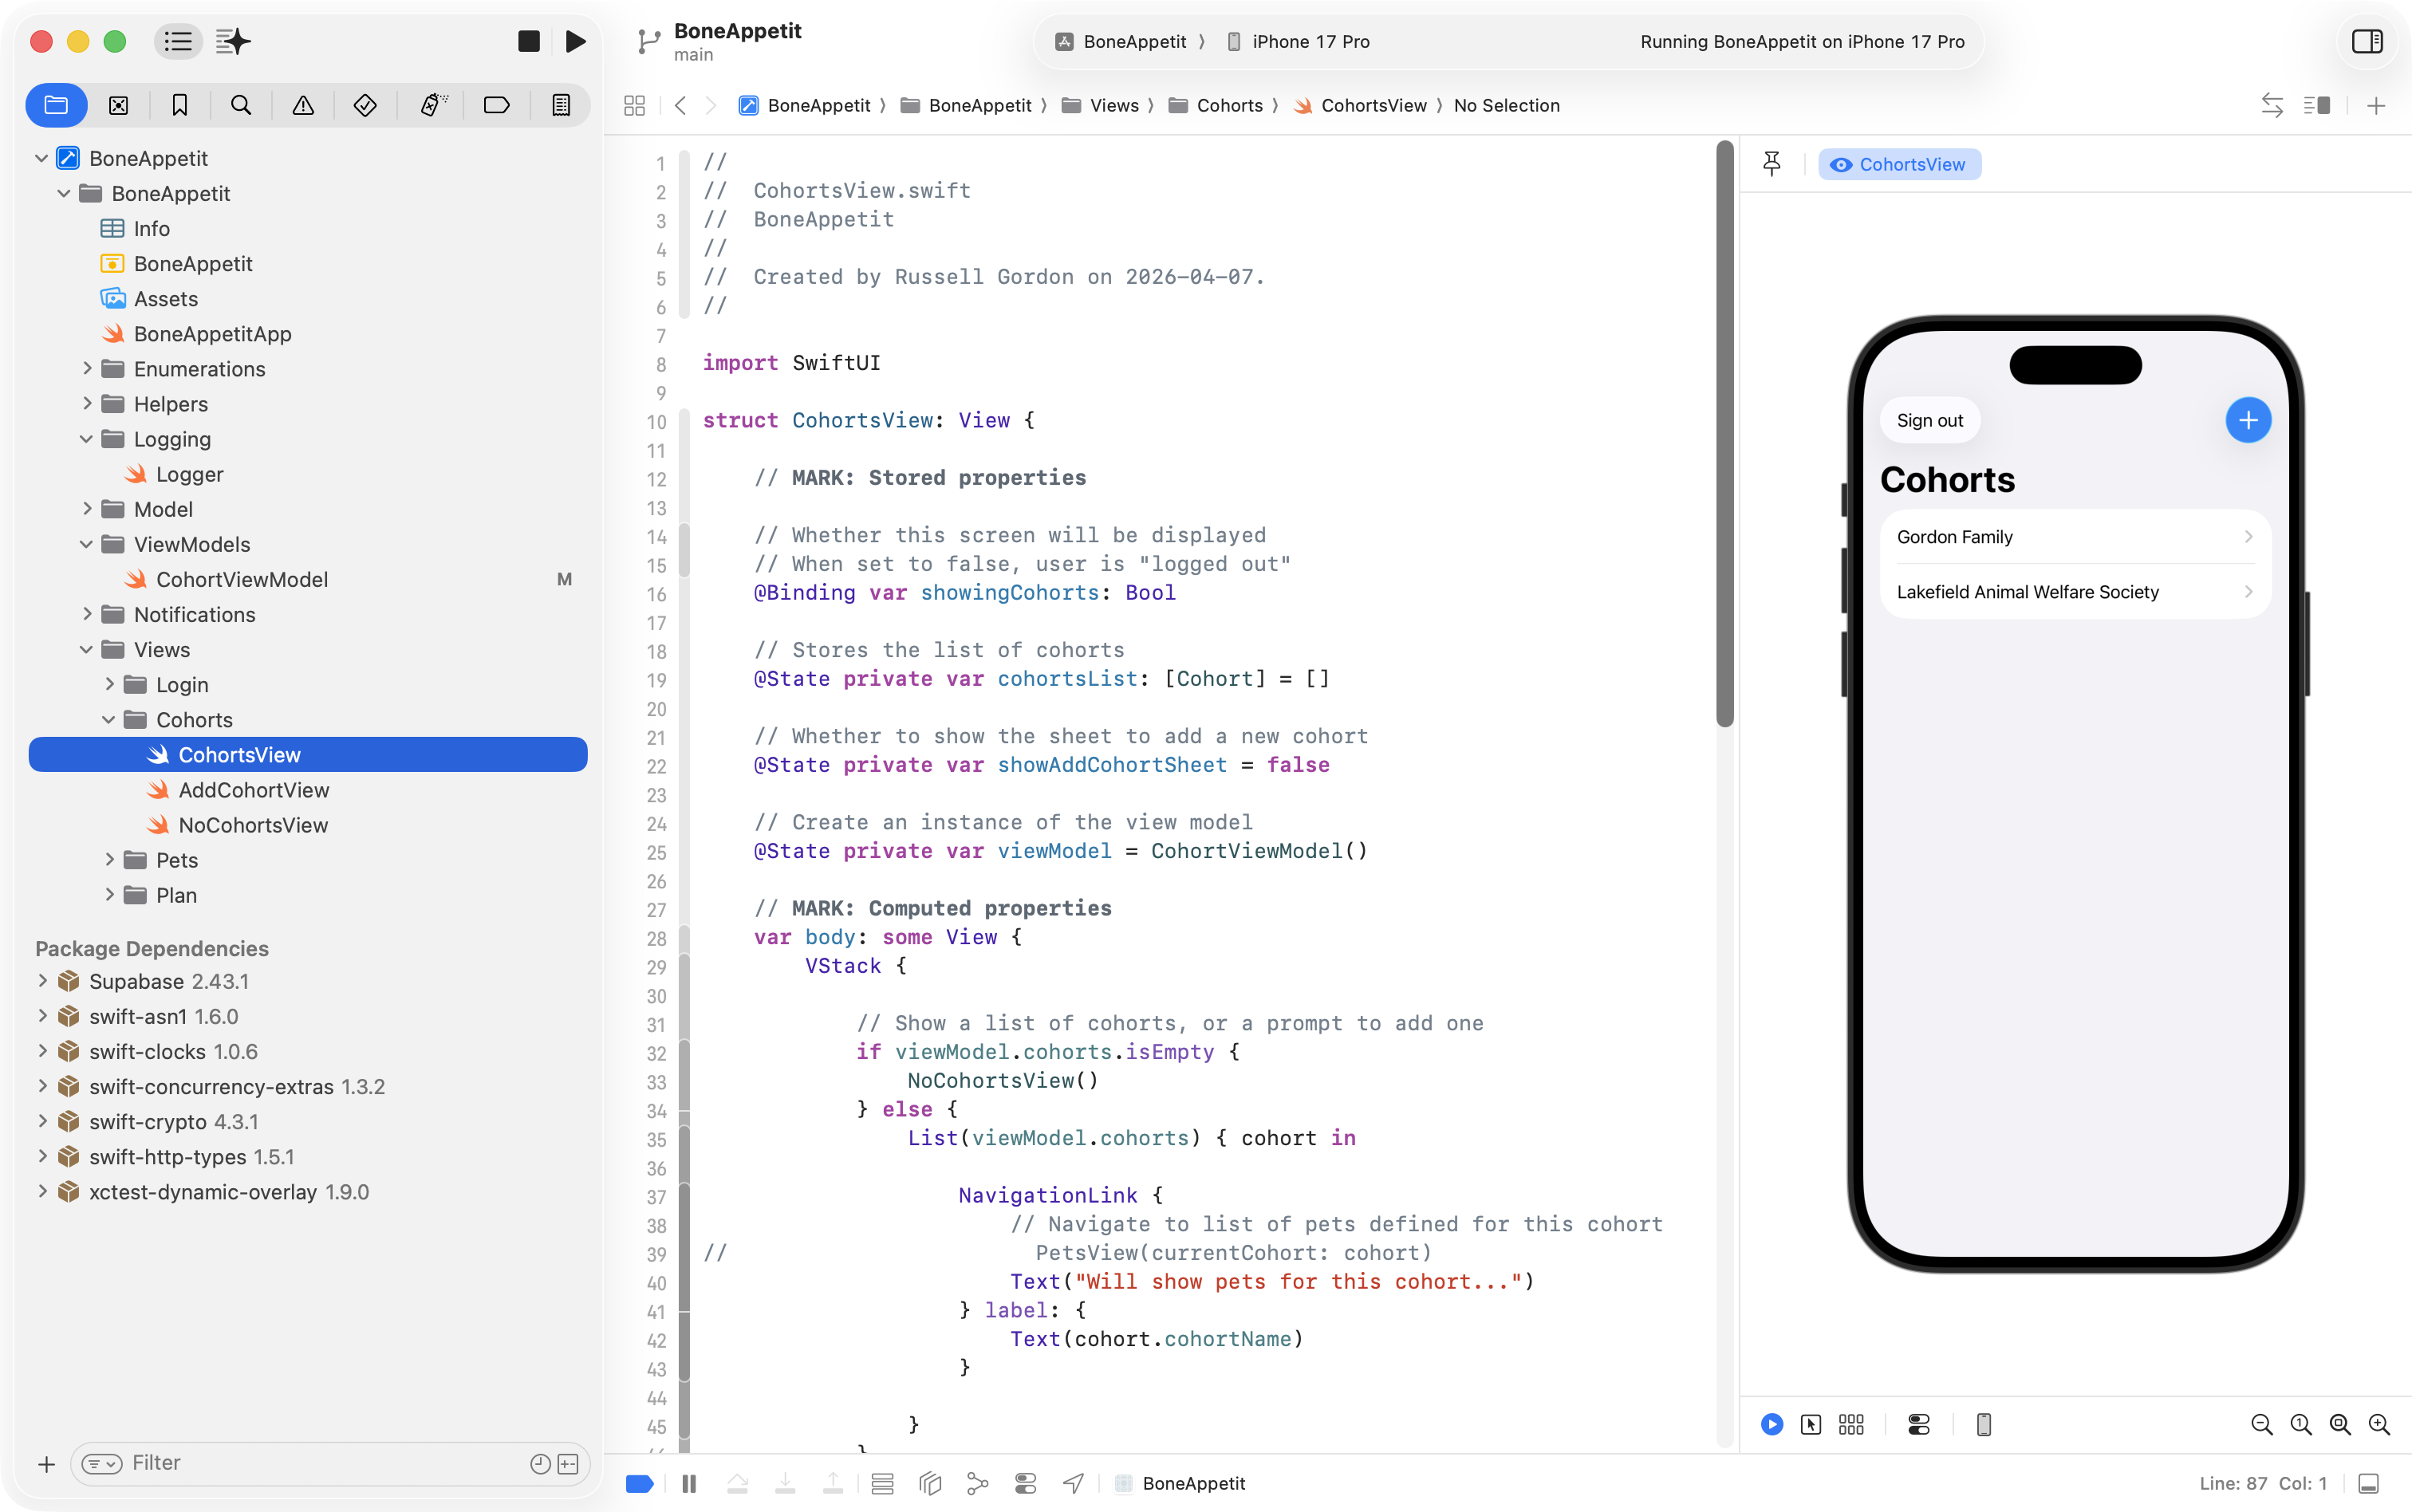
Now that we have the model and view model layers written, we need to adjust the final layer – following the MVVM design pattern – the view (user interface) in the app.
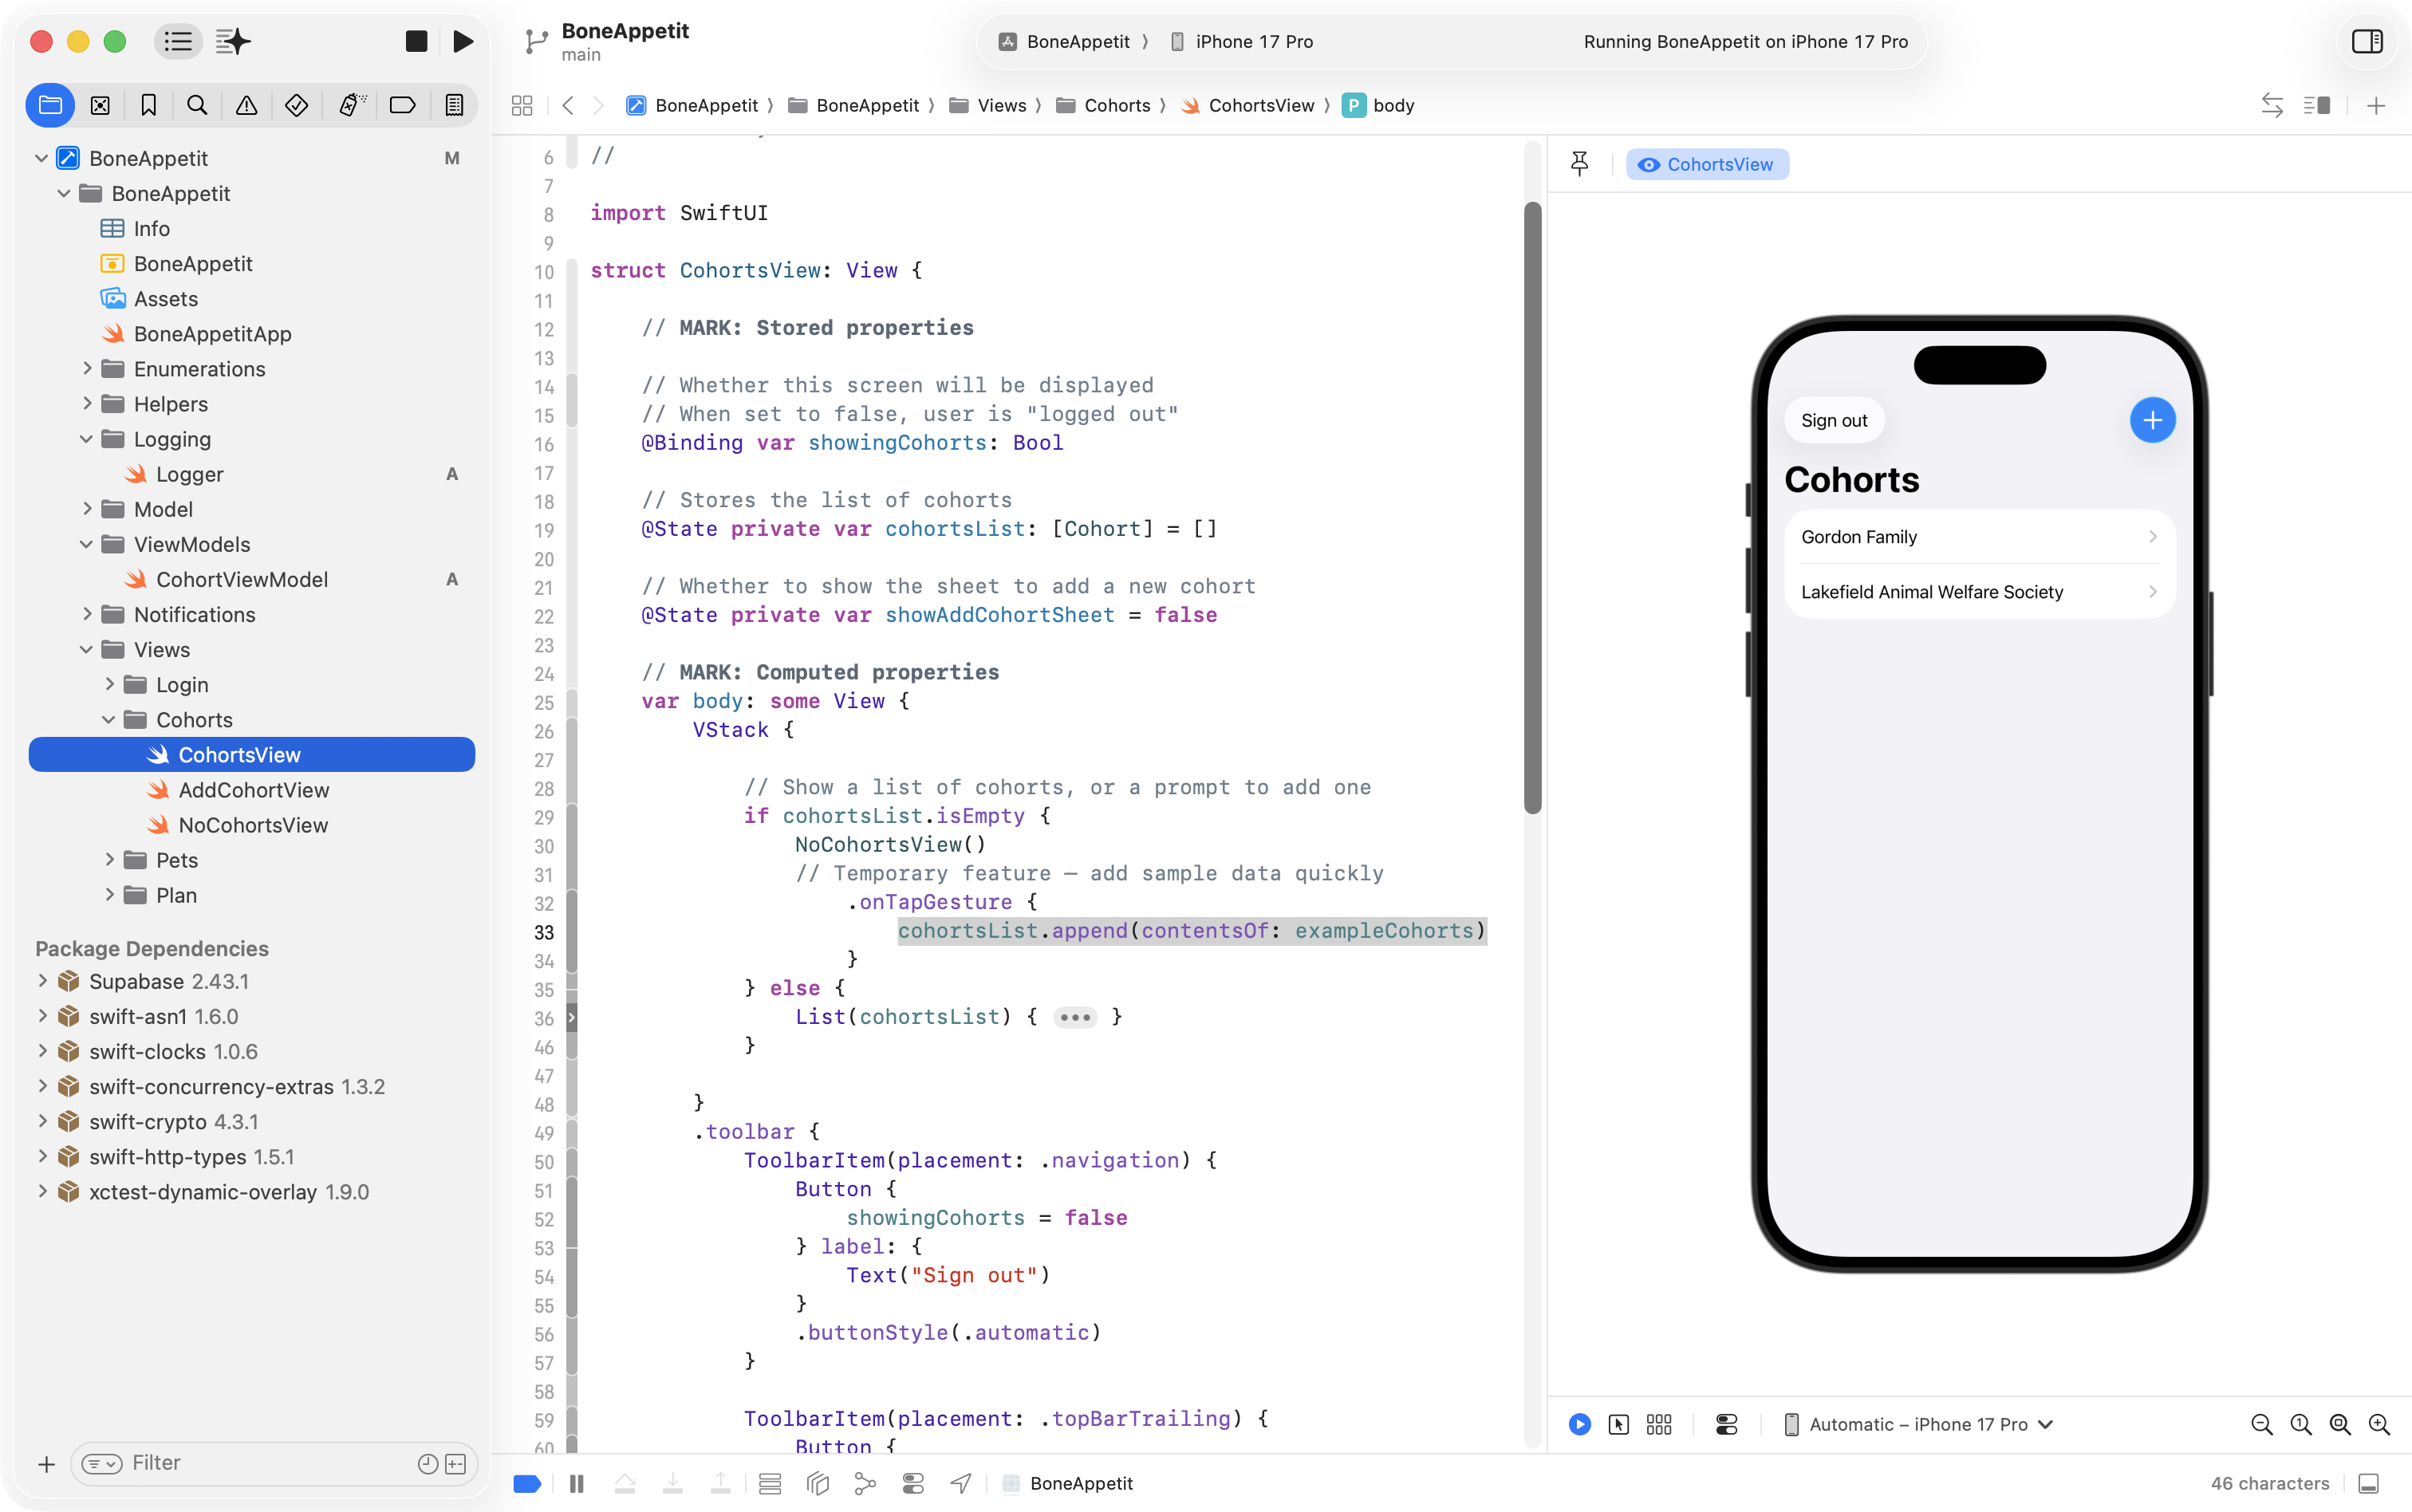
Right now, it just loads placeholder, or mock, data:
Now, we adjust the view to use the view model instead of mock data:
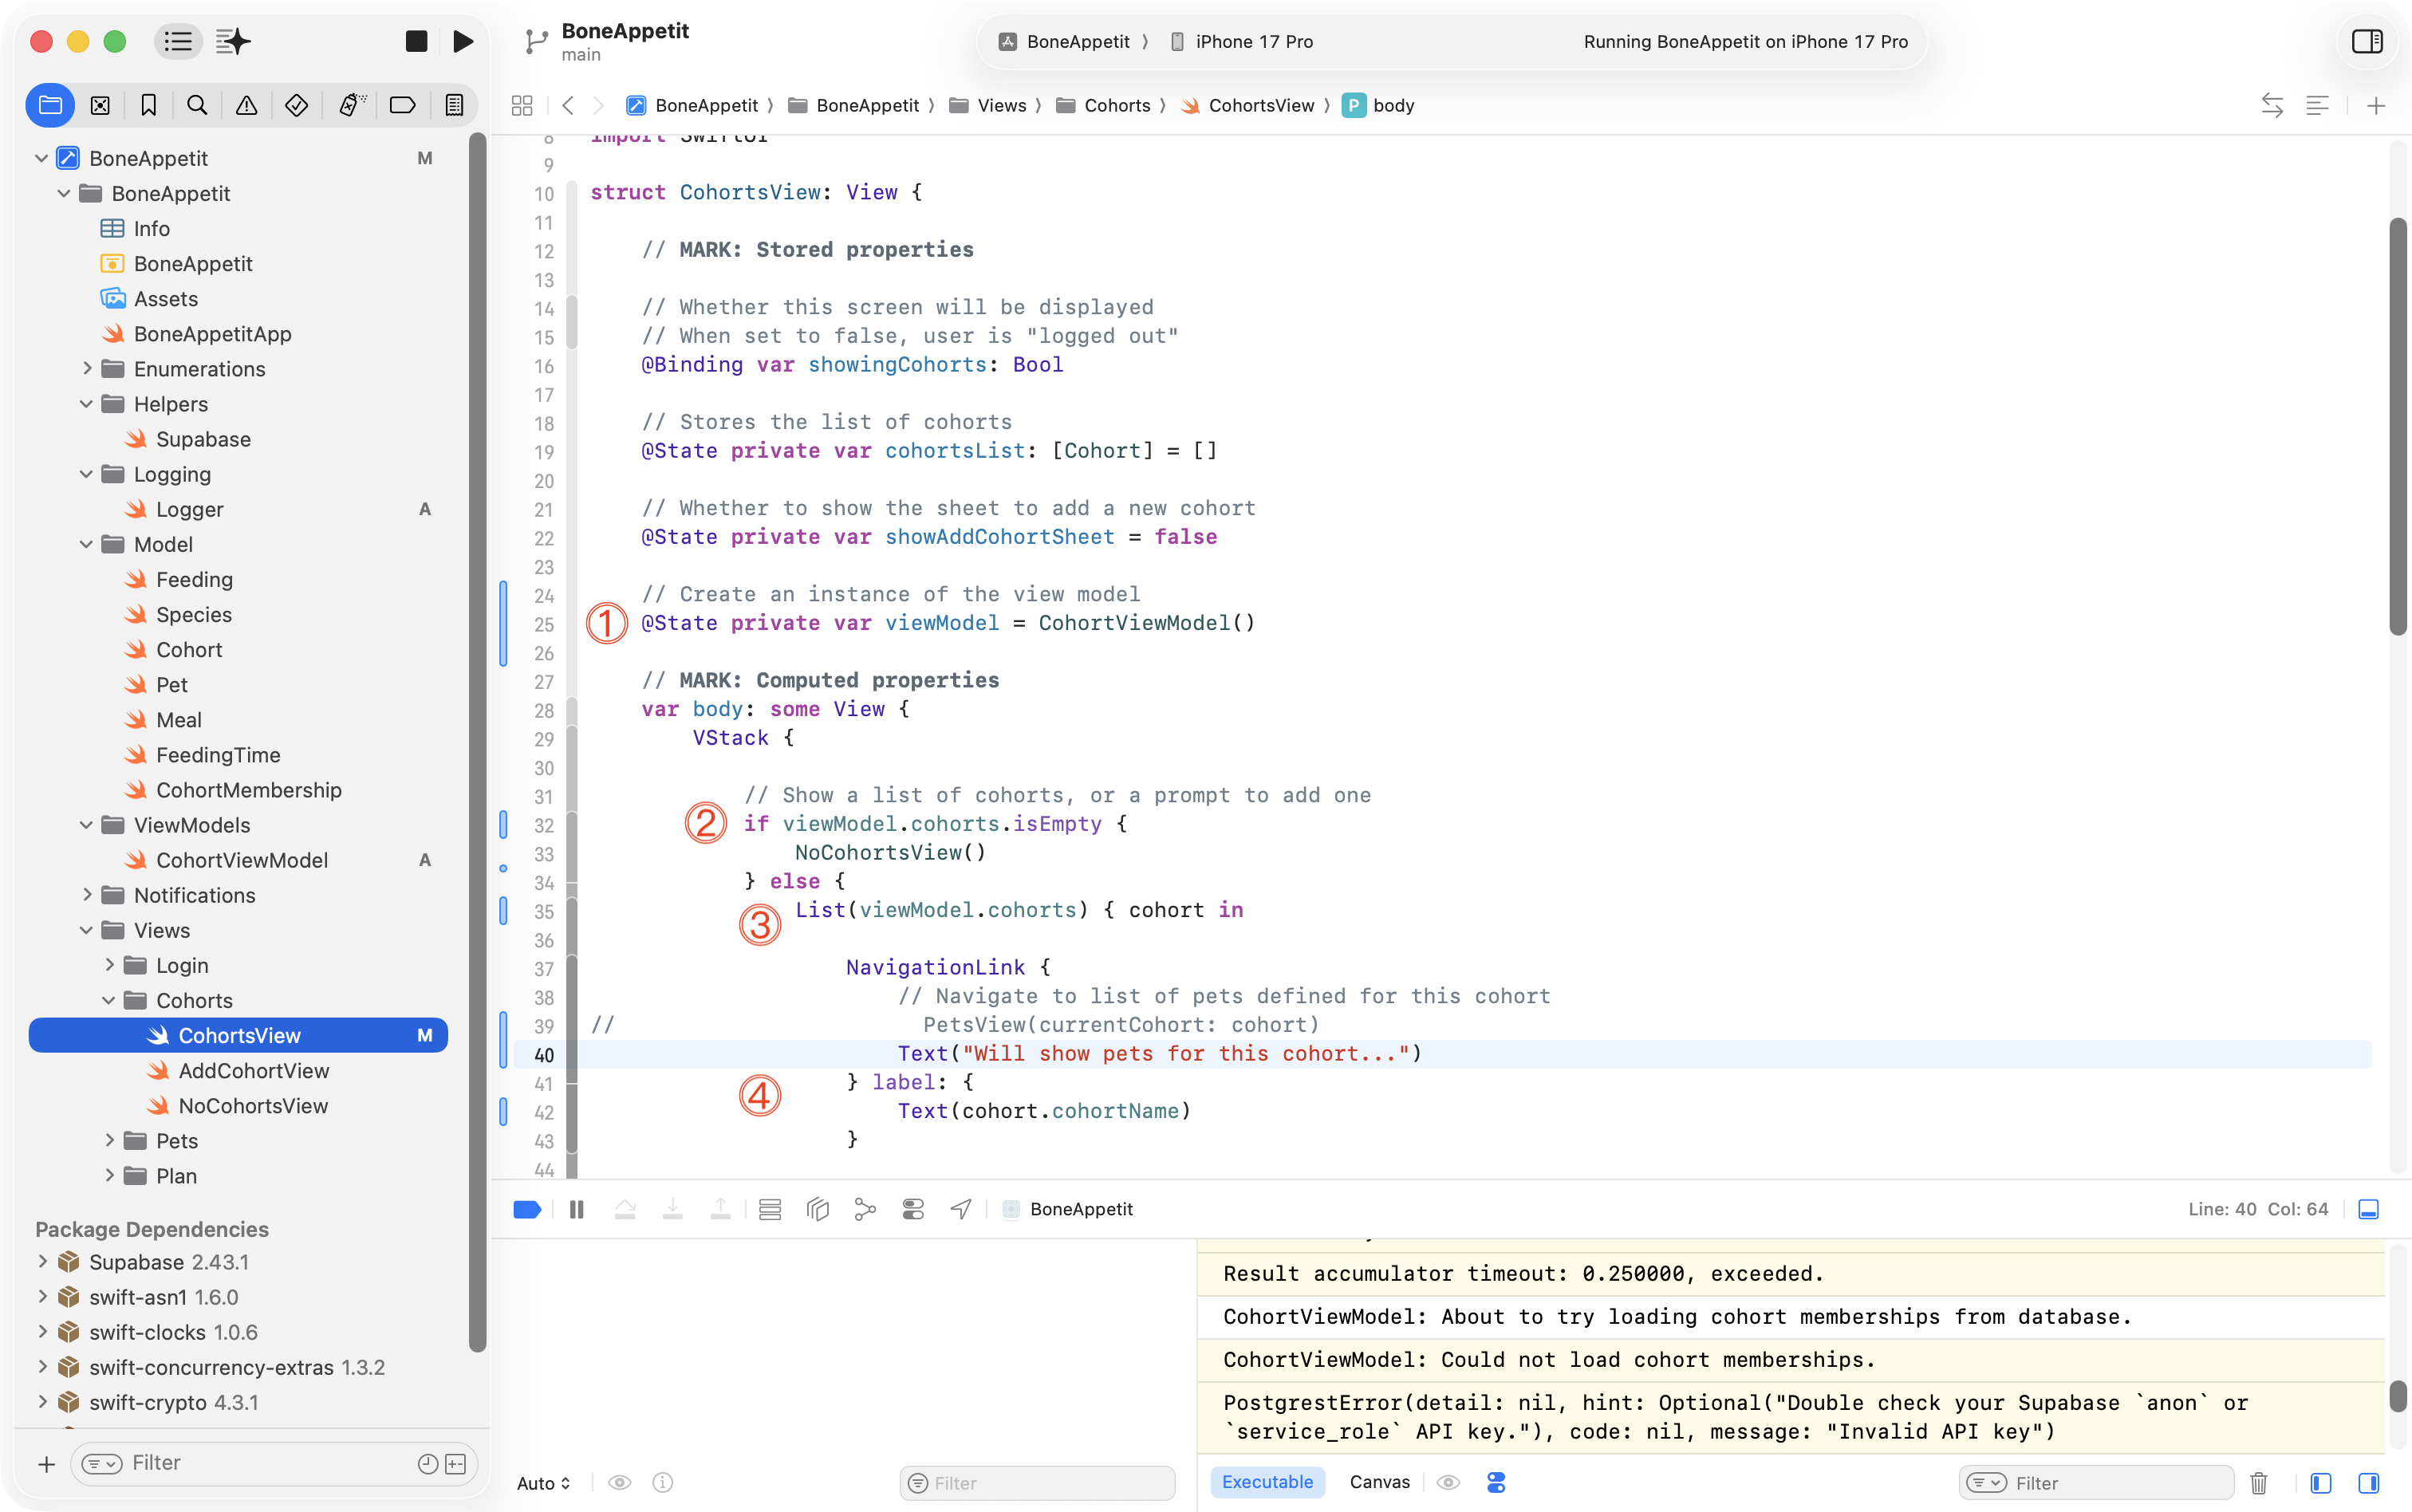
In this code there are a view things to examine carefully:
DISCUSSION
- We create an instance of the view model as a stored property on the view.
- Rather than checking the old array that held example data –
cohortsList– to see if it contains any data – we check the array that is held within the view model.- Rather than iterating over the old array that held example data –
cohortsList– we iterate over the array that is held within the view model.- Each item in the list, for now, will show a
NavigationLinkthat shows aTextview that displays the cohort name.
You might now notice that in the bottom right corner, there are error messages showing in the console:
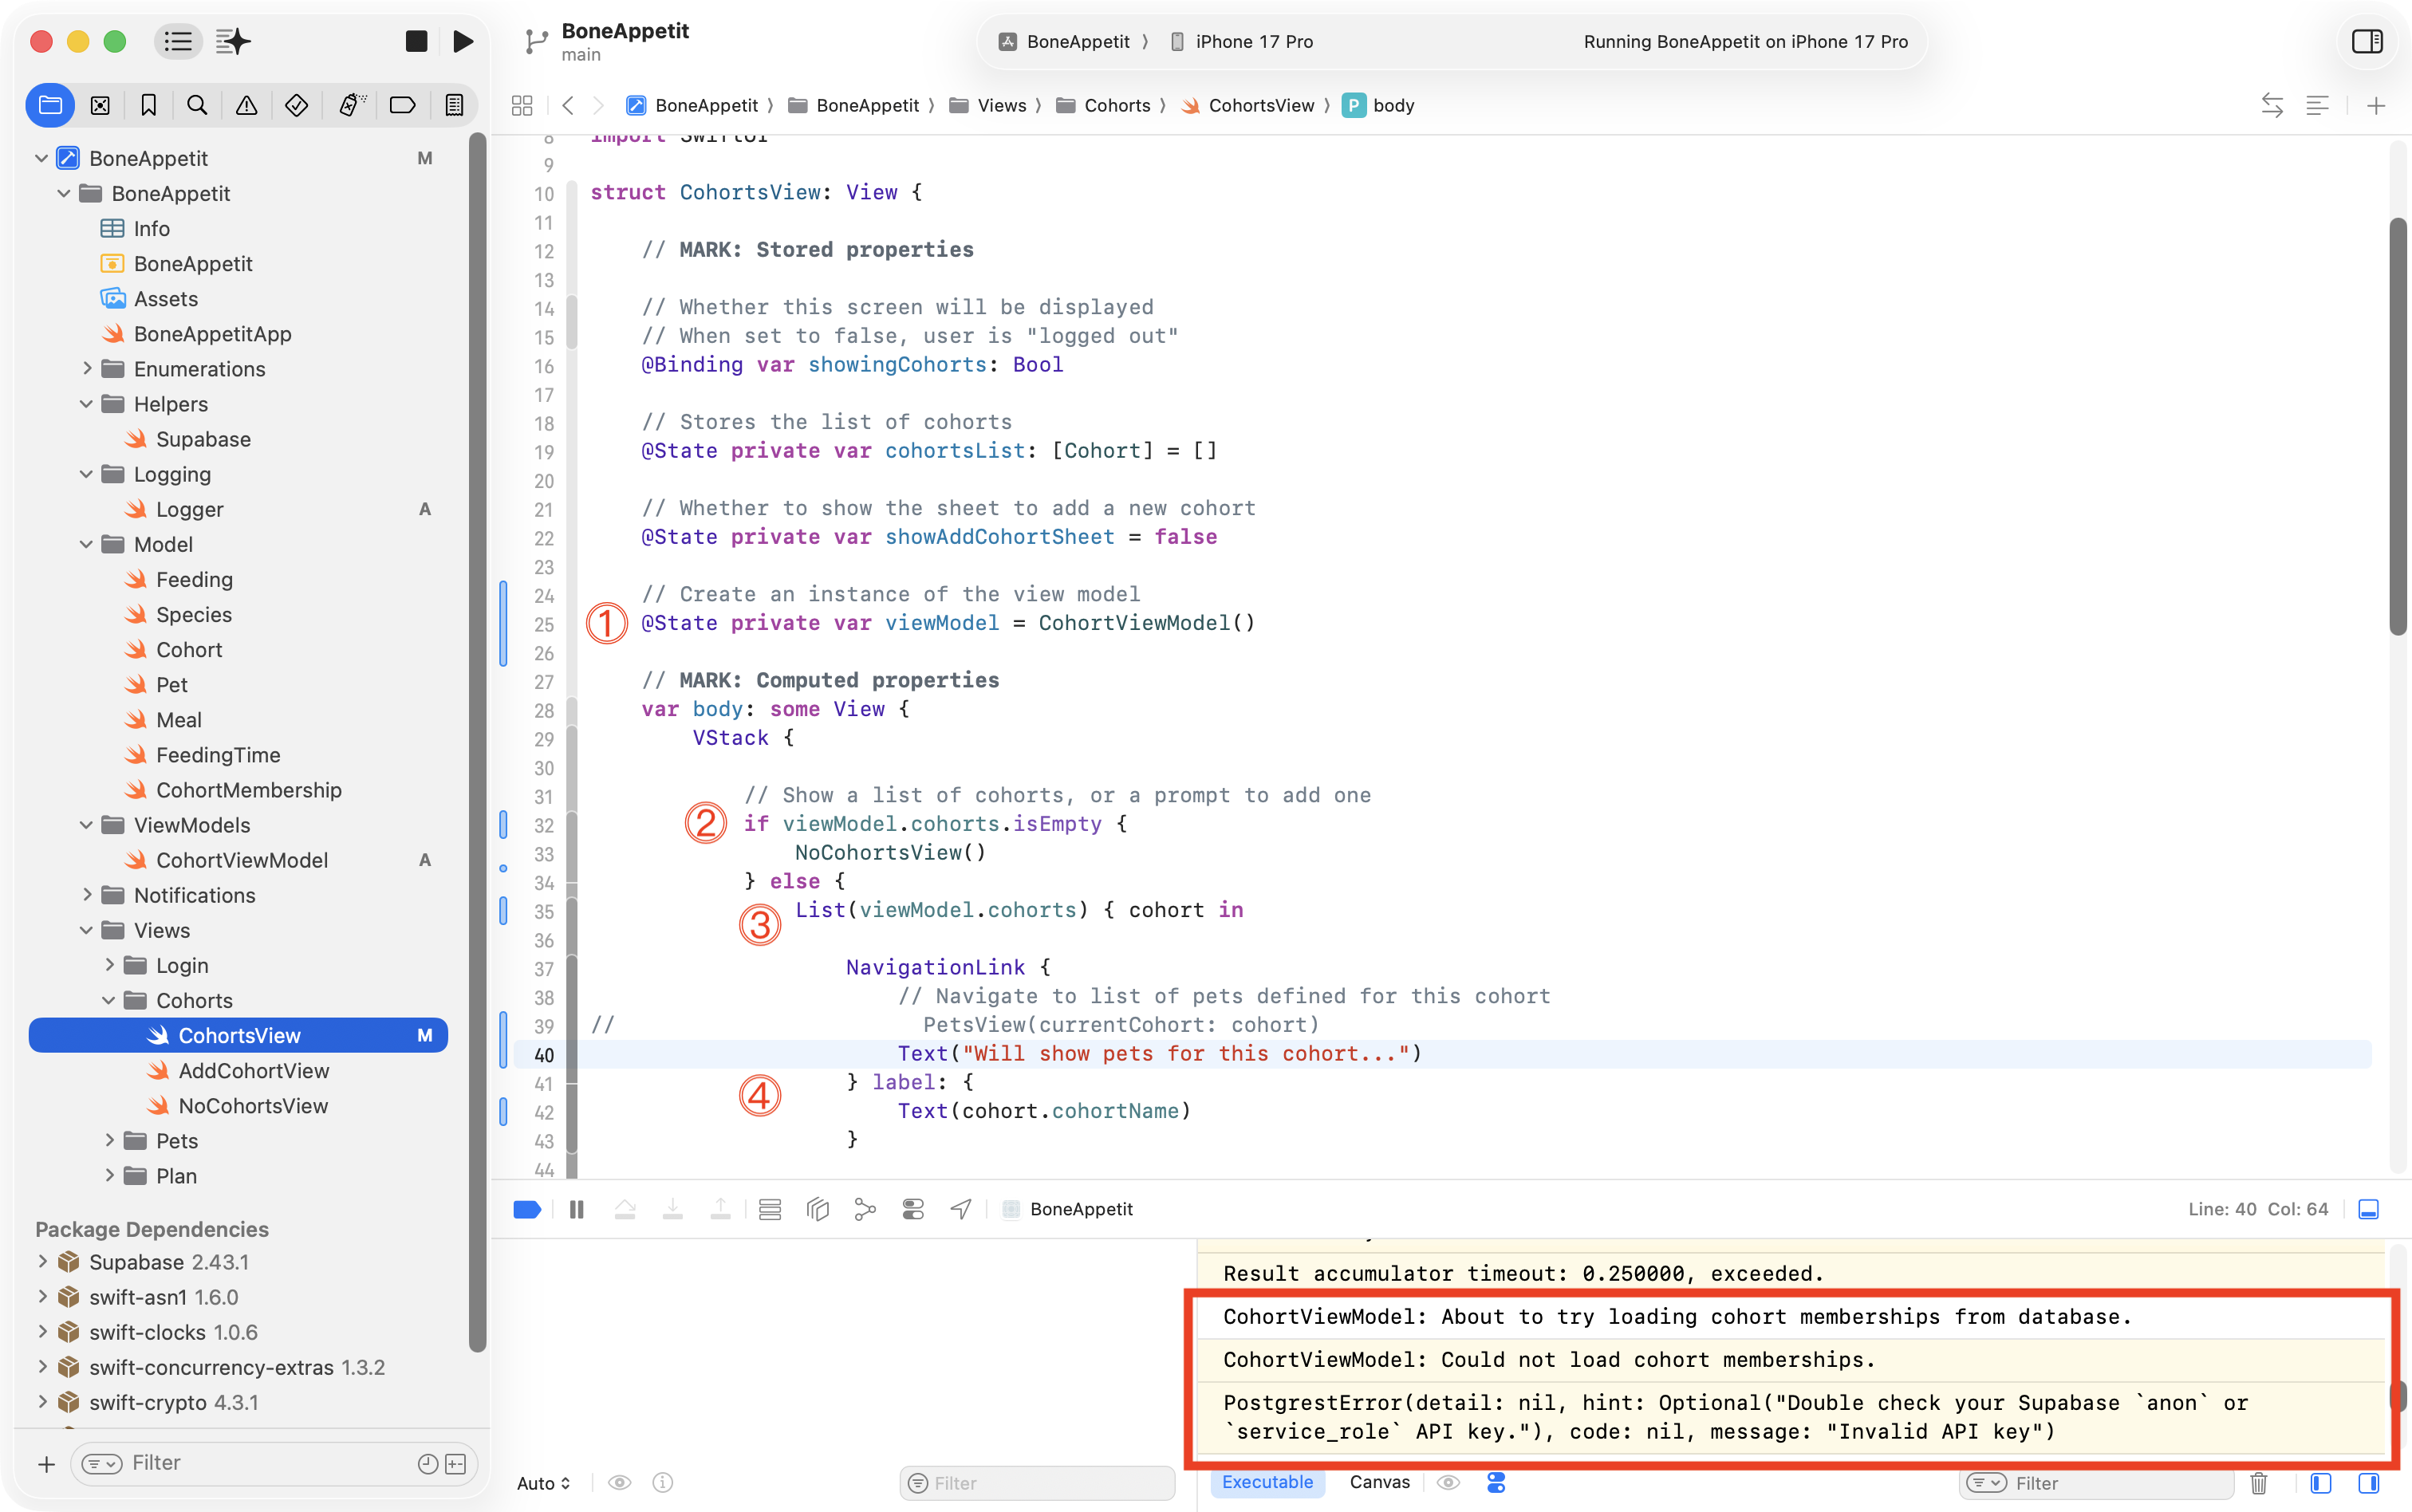
This is a good example of a logical error – the app runs, but no cohorts are shown – even though we know there are cohorts in the database:
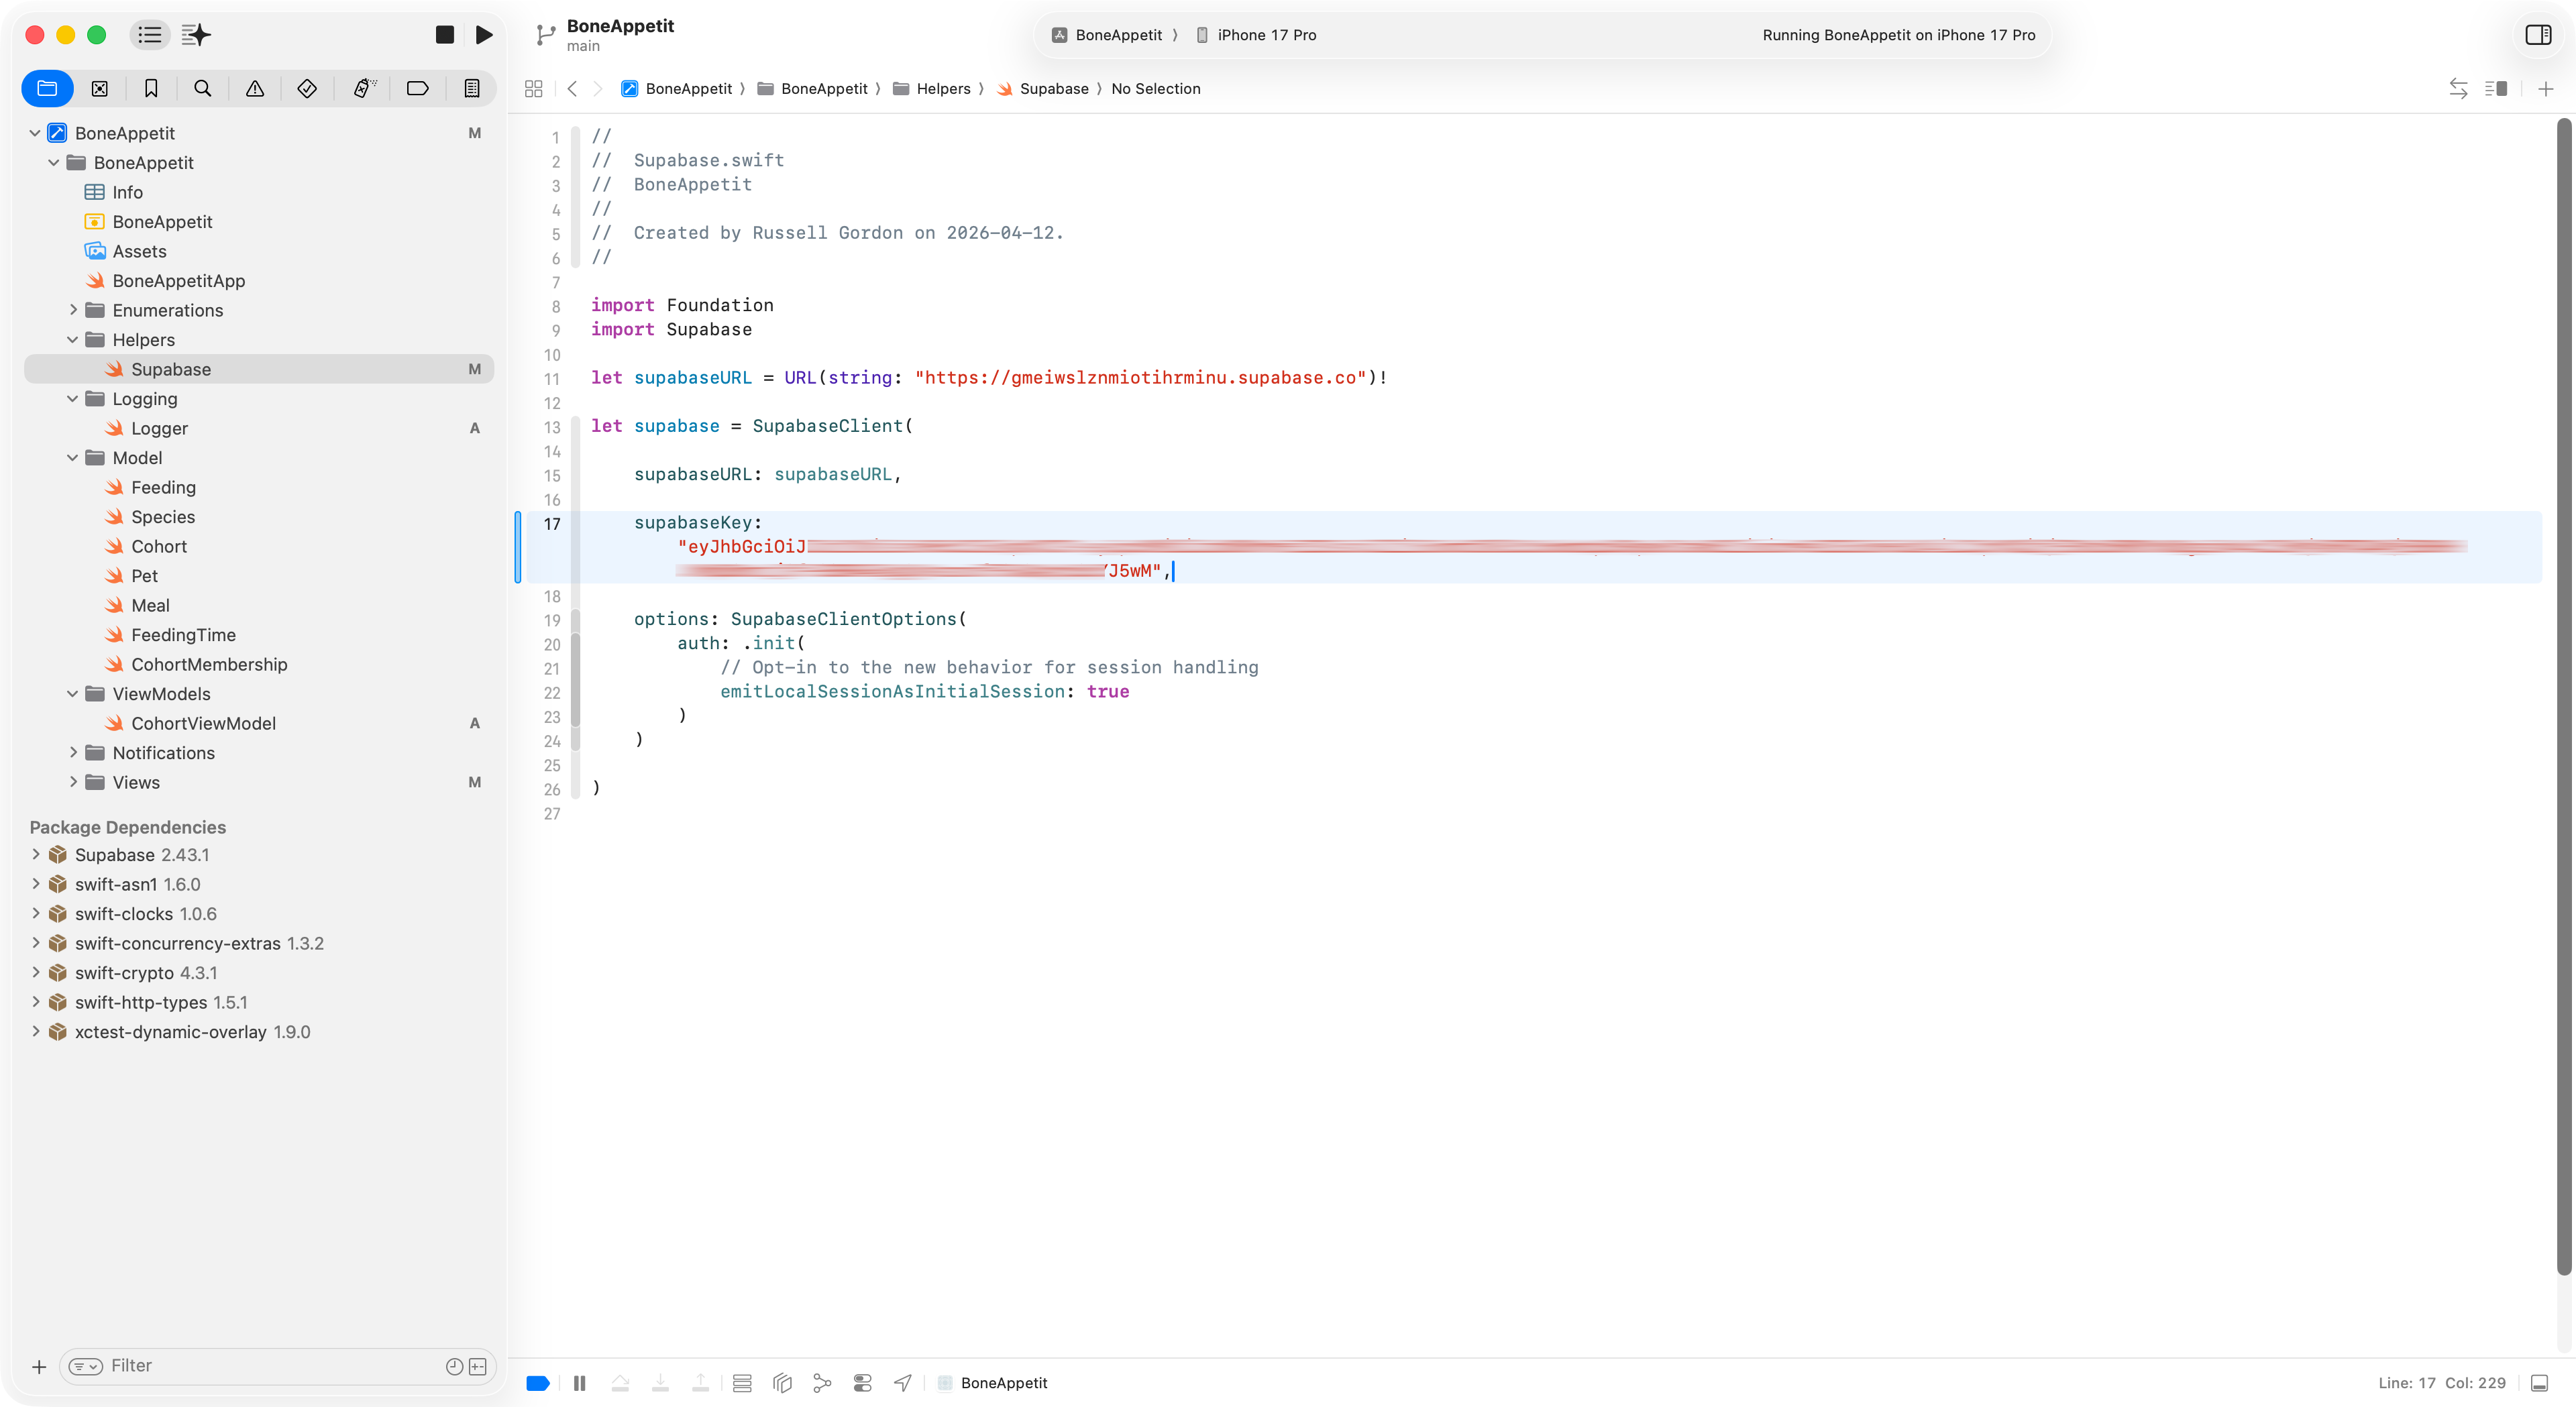
The error message states:
Double check your Supabase `anon` or `service_role` API key.
Looking carefully, we see that in this project, the key in the Supabase.swift helper does not match the key in the actual database we are trying to use:
.png)
After adding the correct key:
The view now retrieves information from the database:
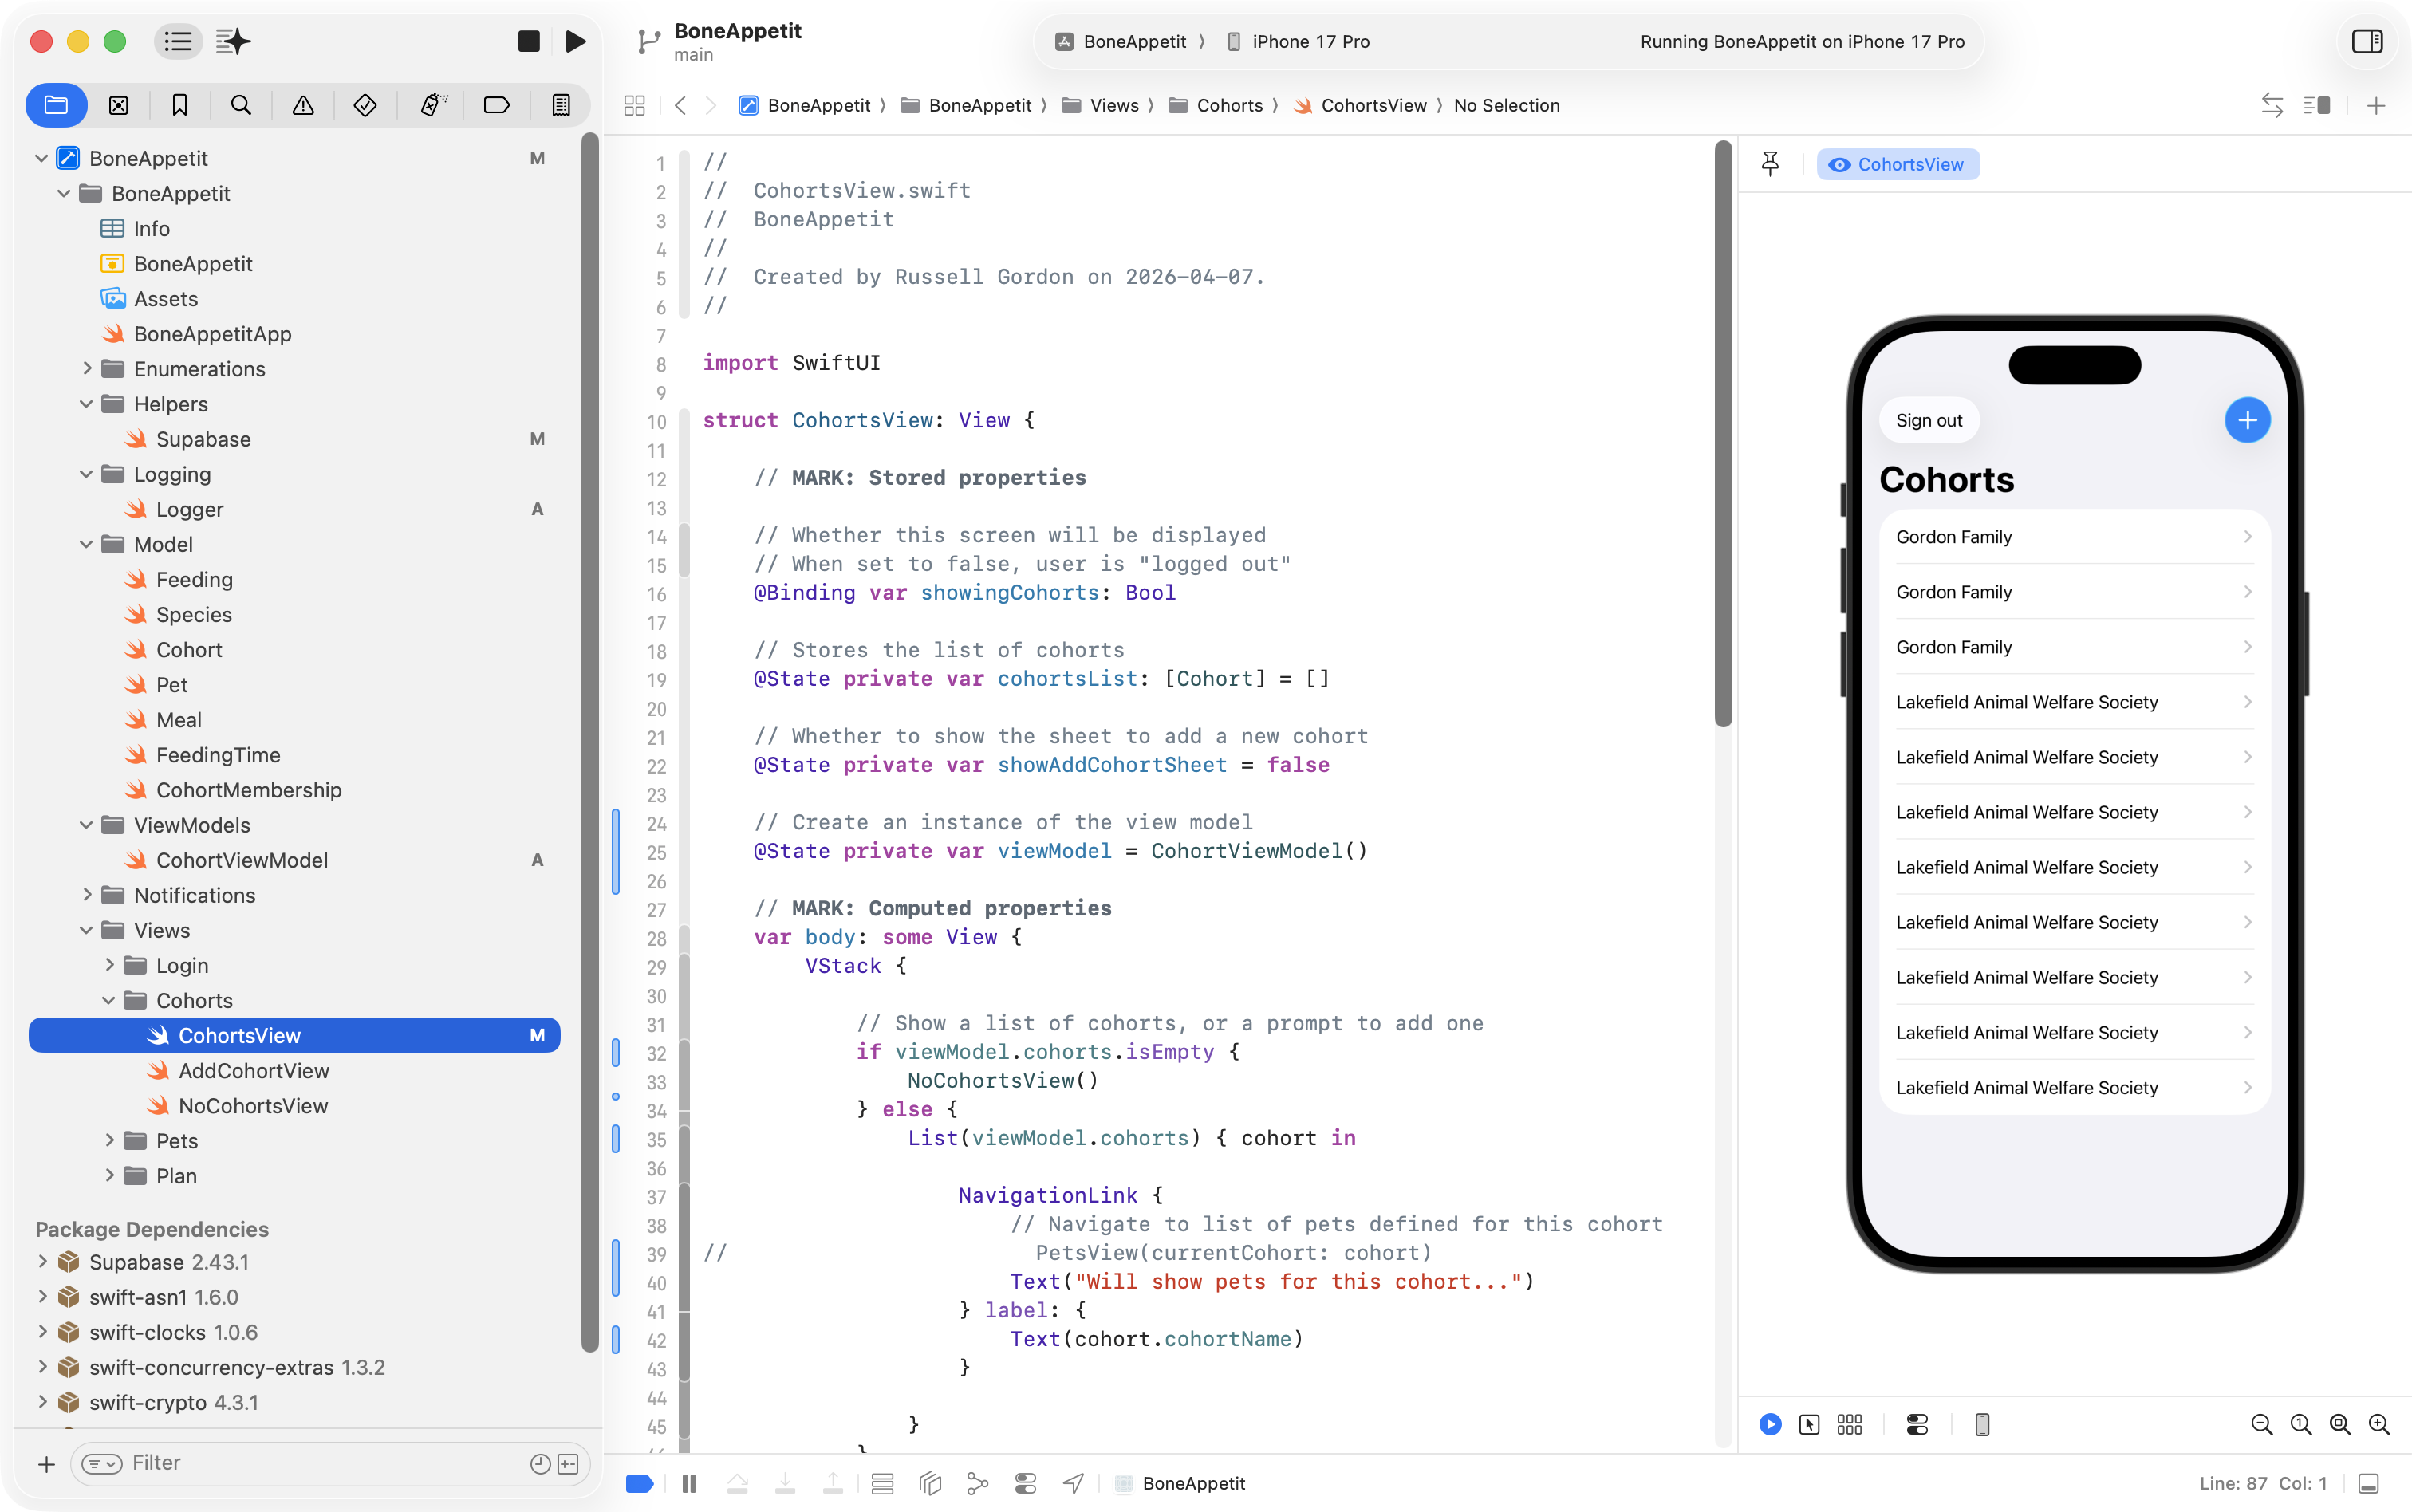
This is a success – despite the information not looking quite right – more on that in a moment.
Limiting results
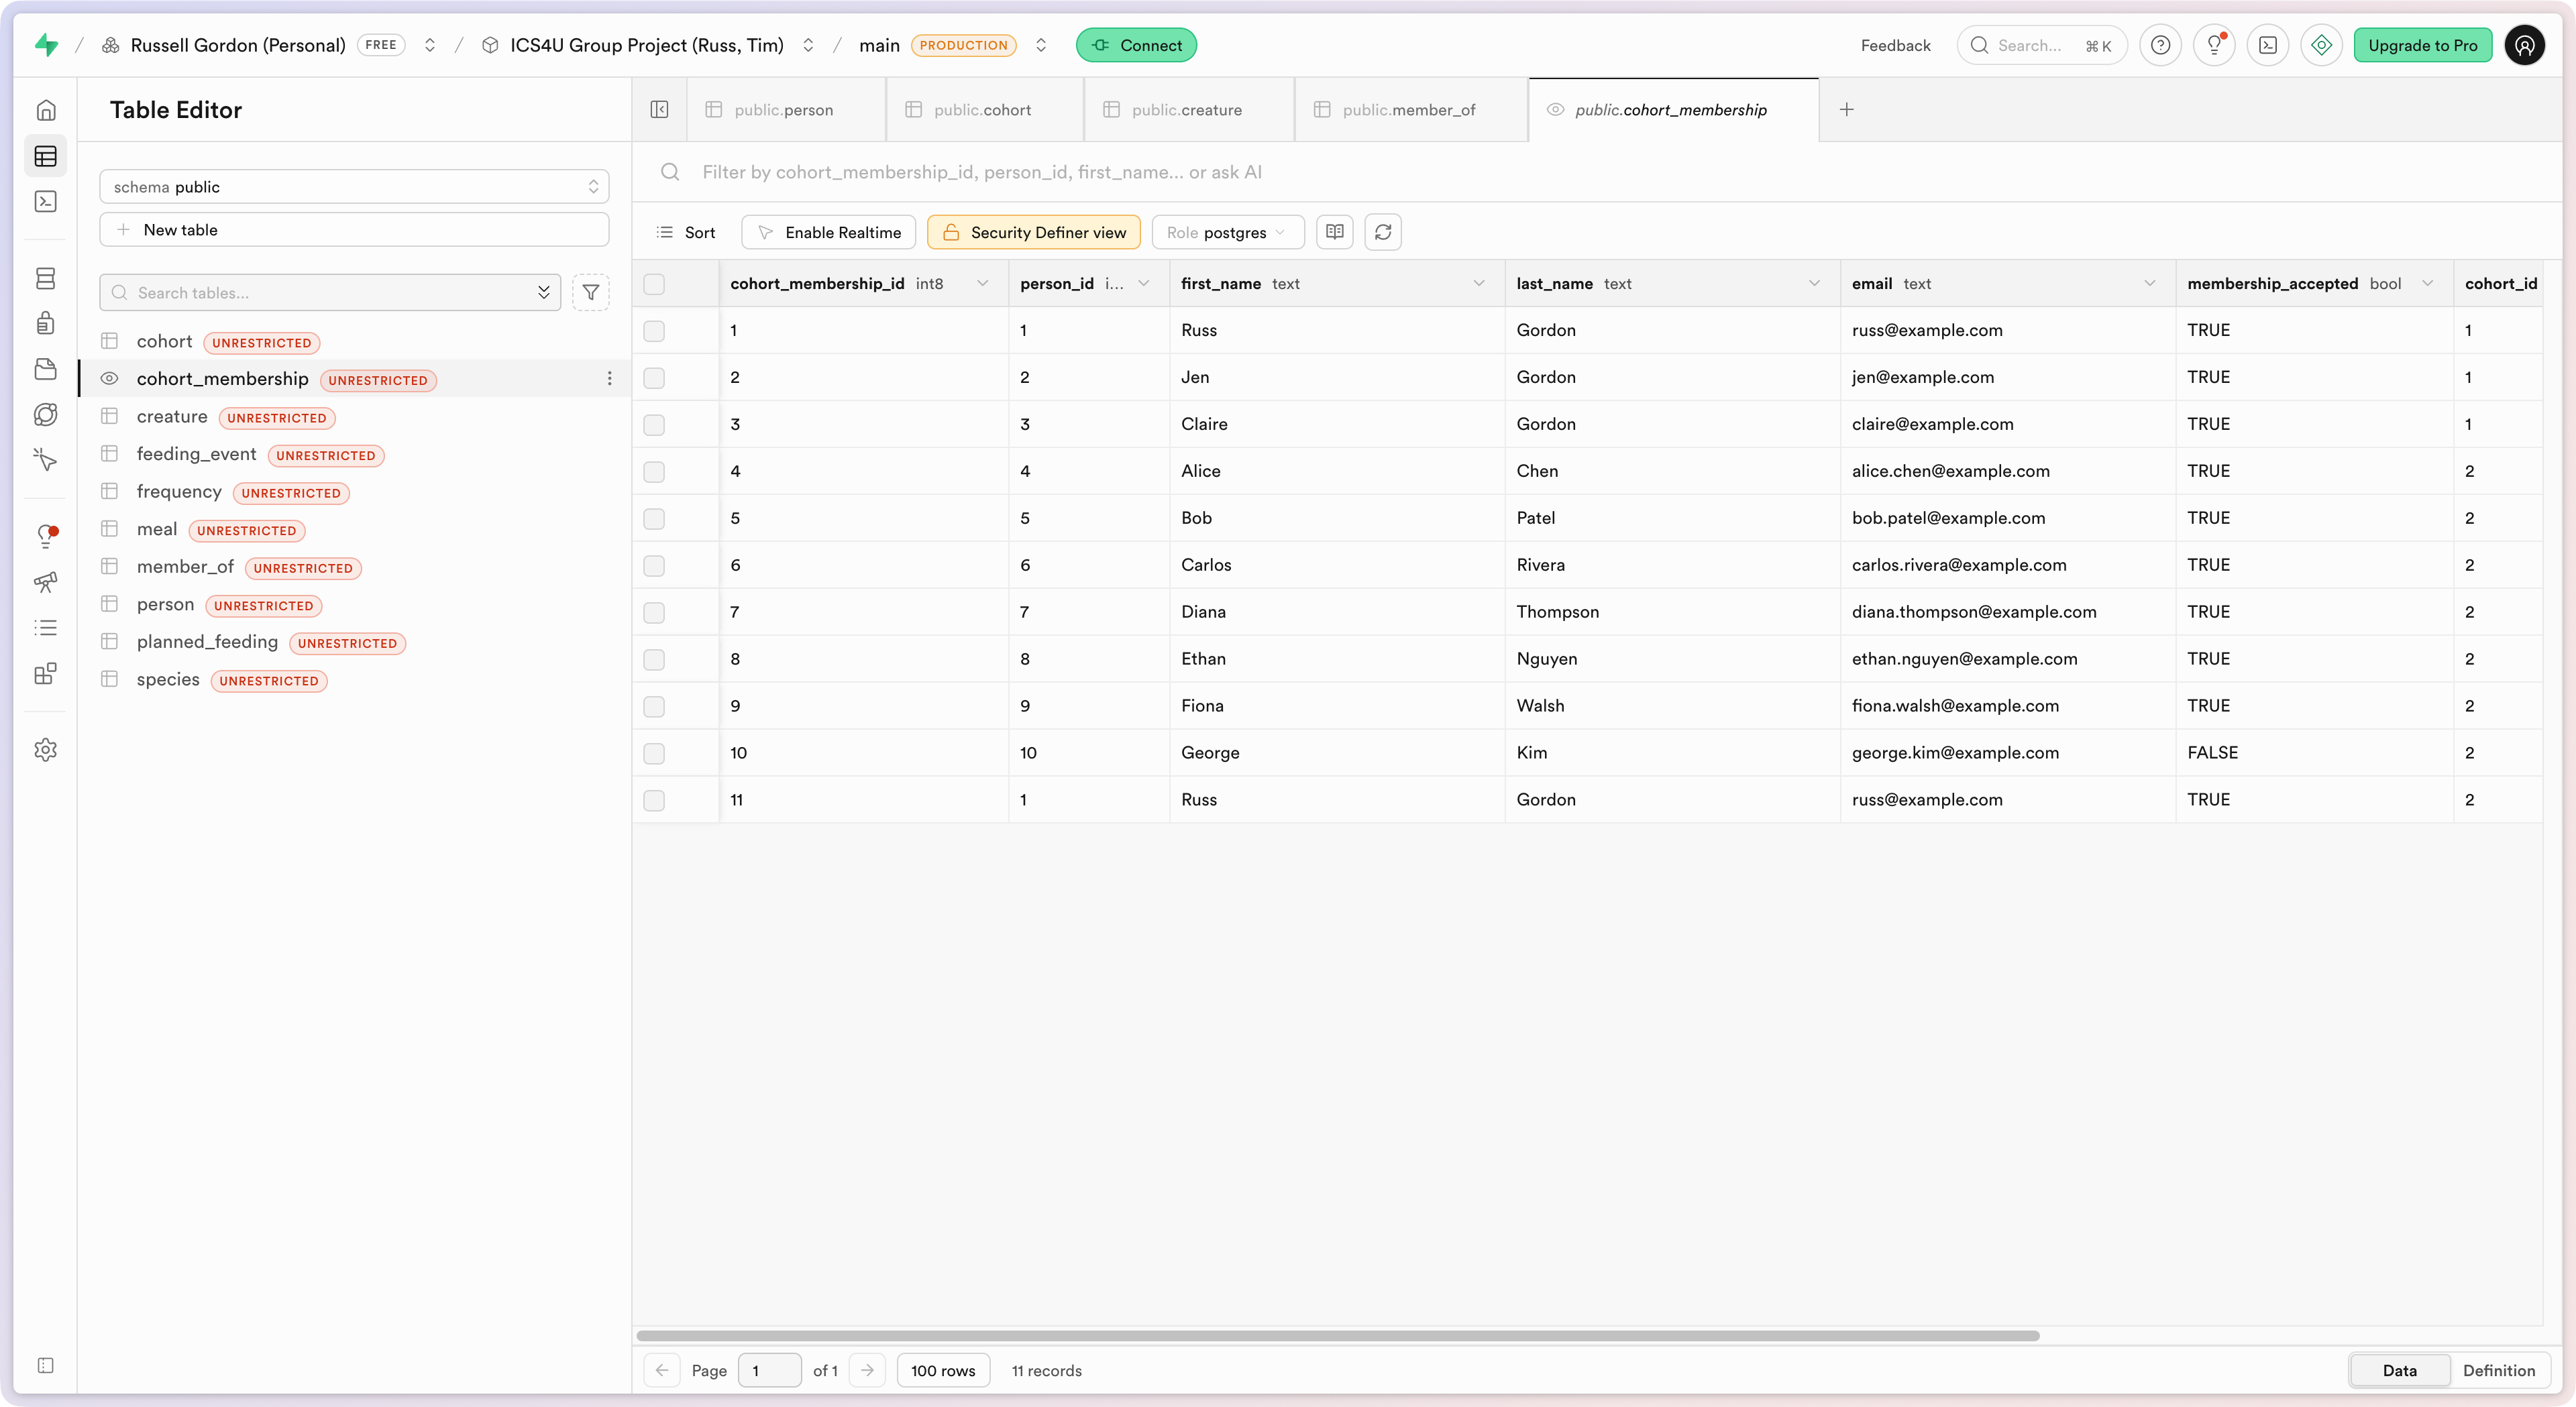
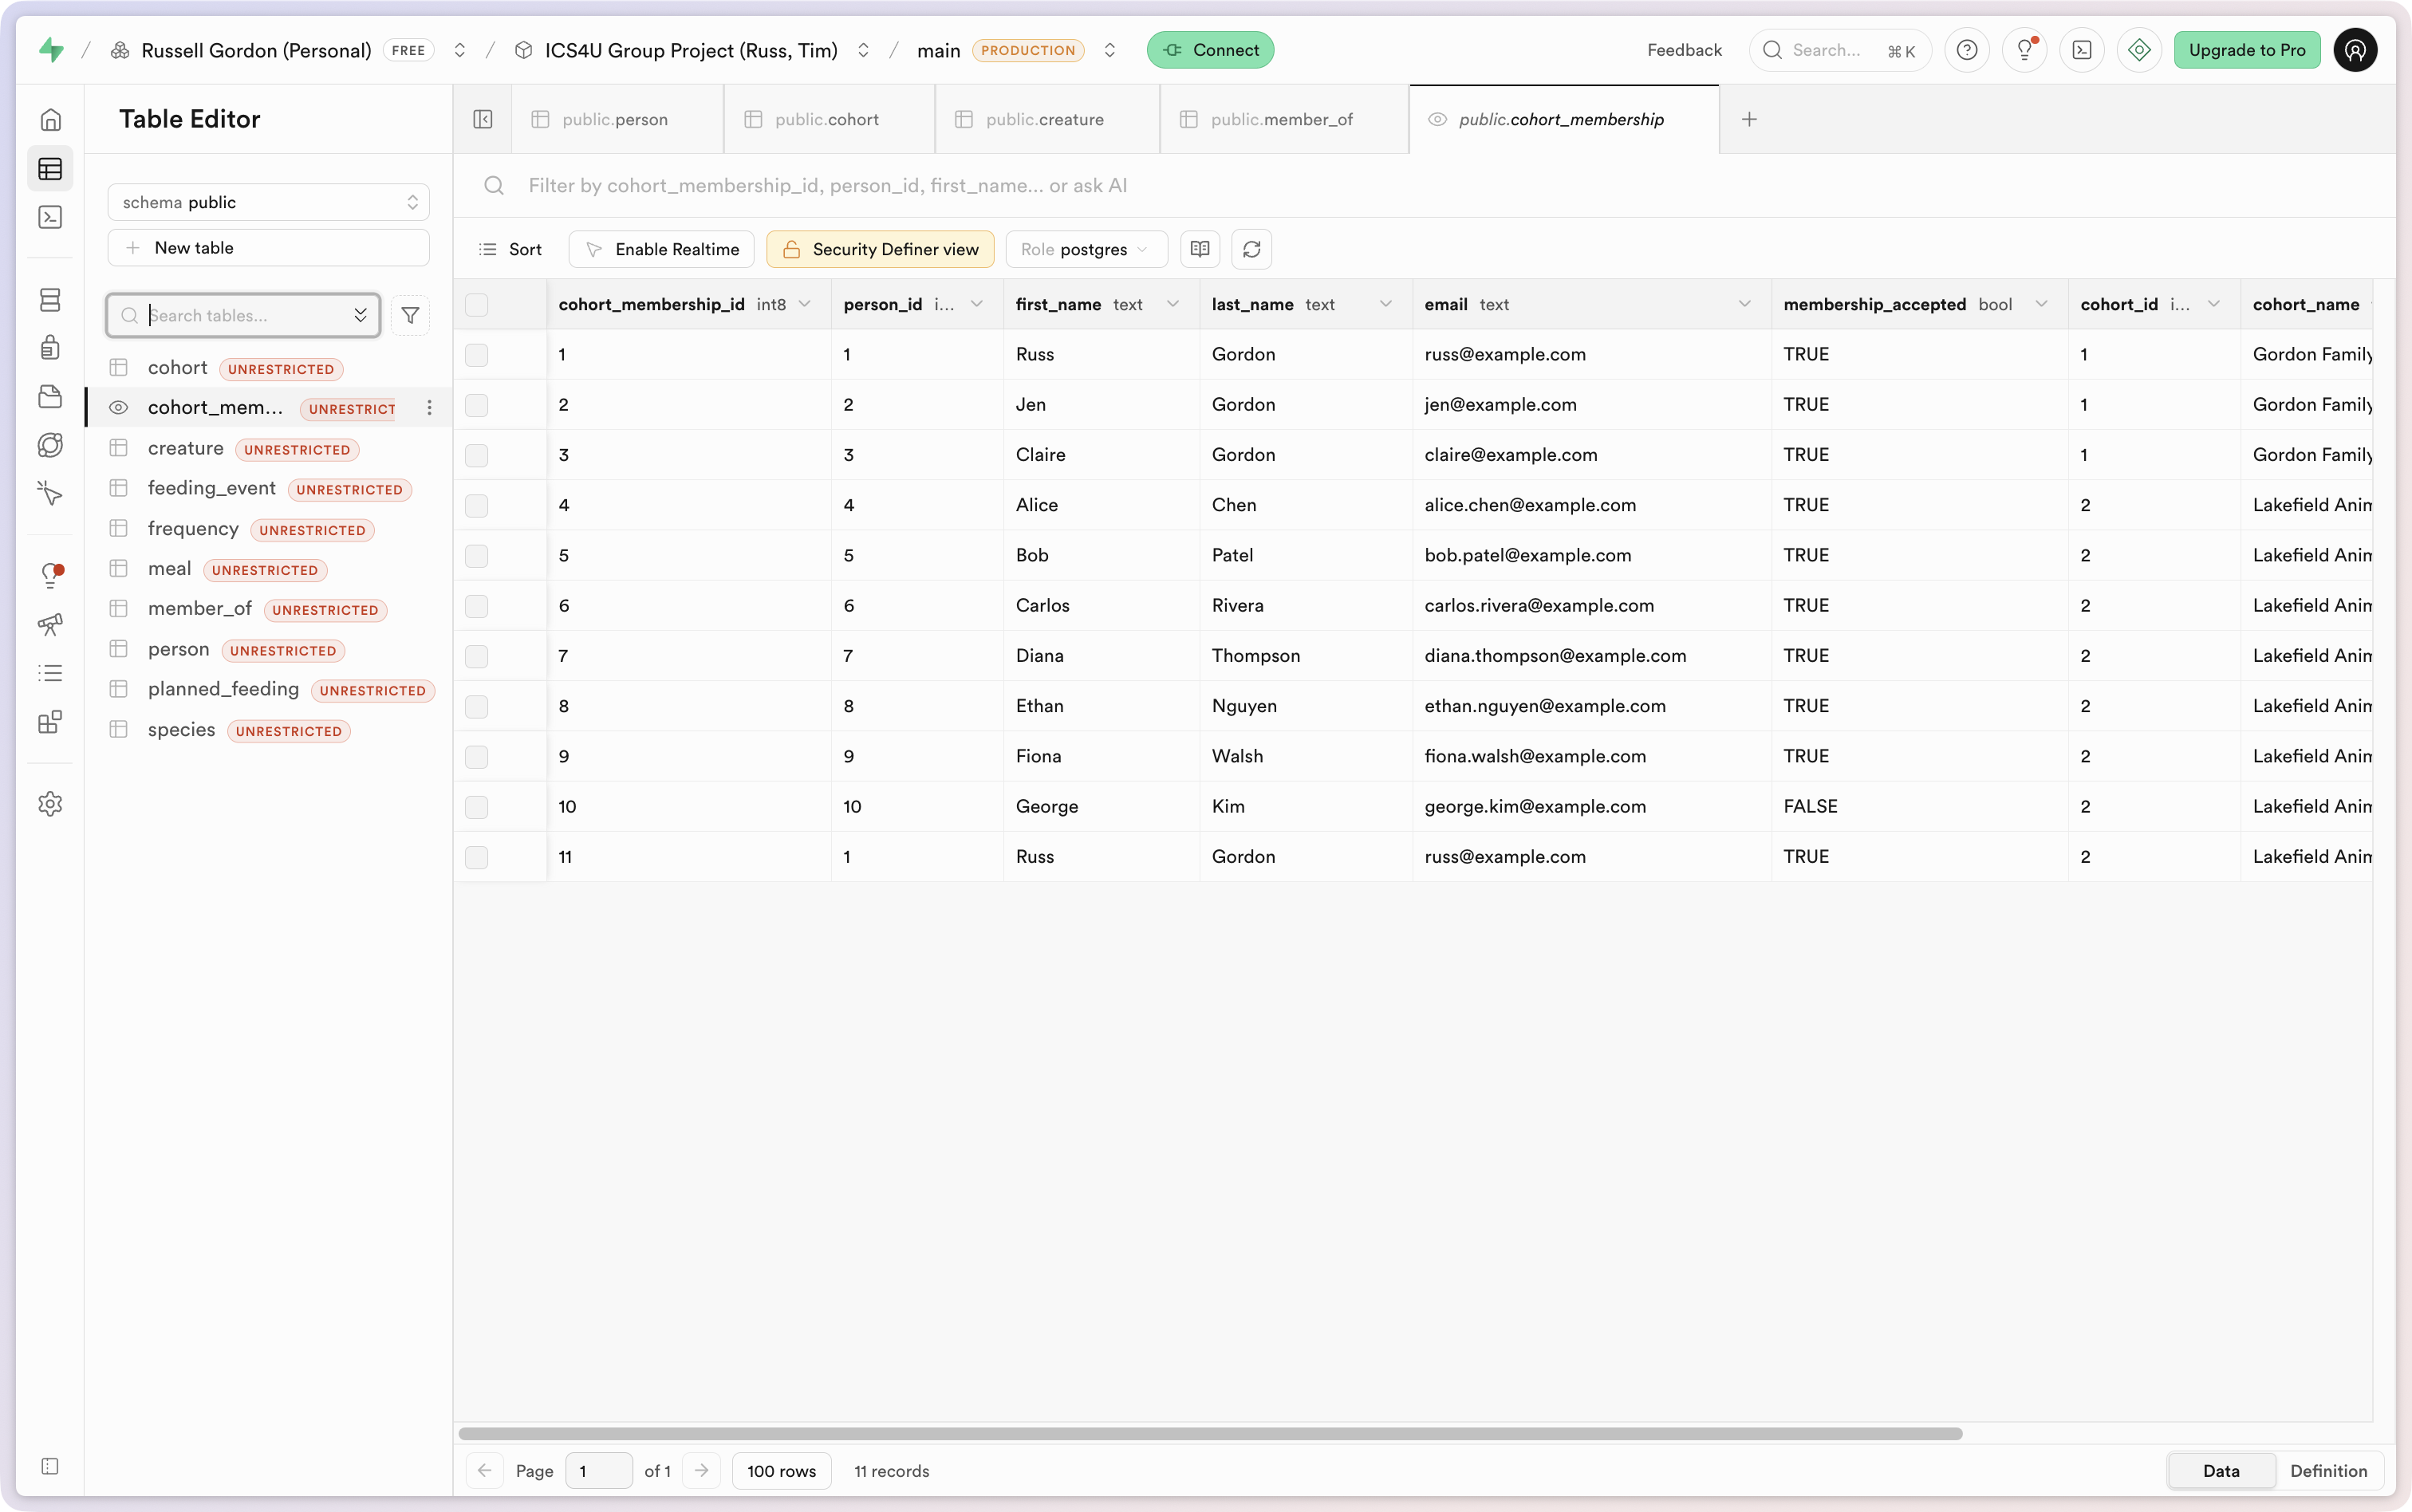
Why does the user interface in our app show so many rows?
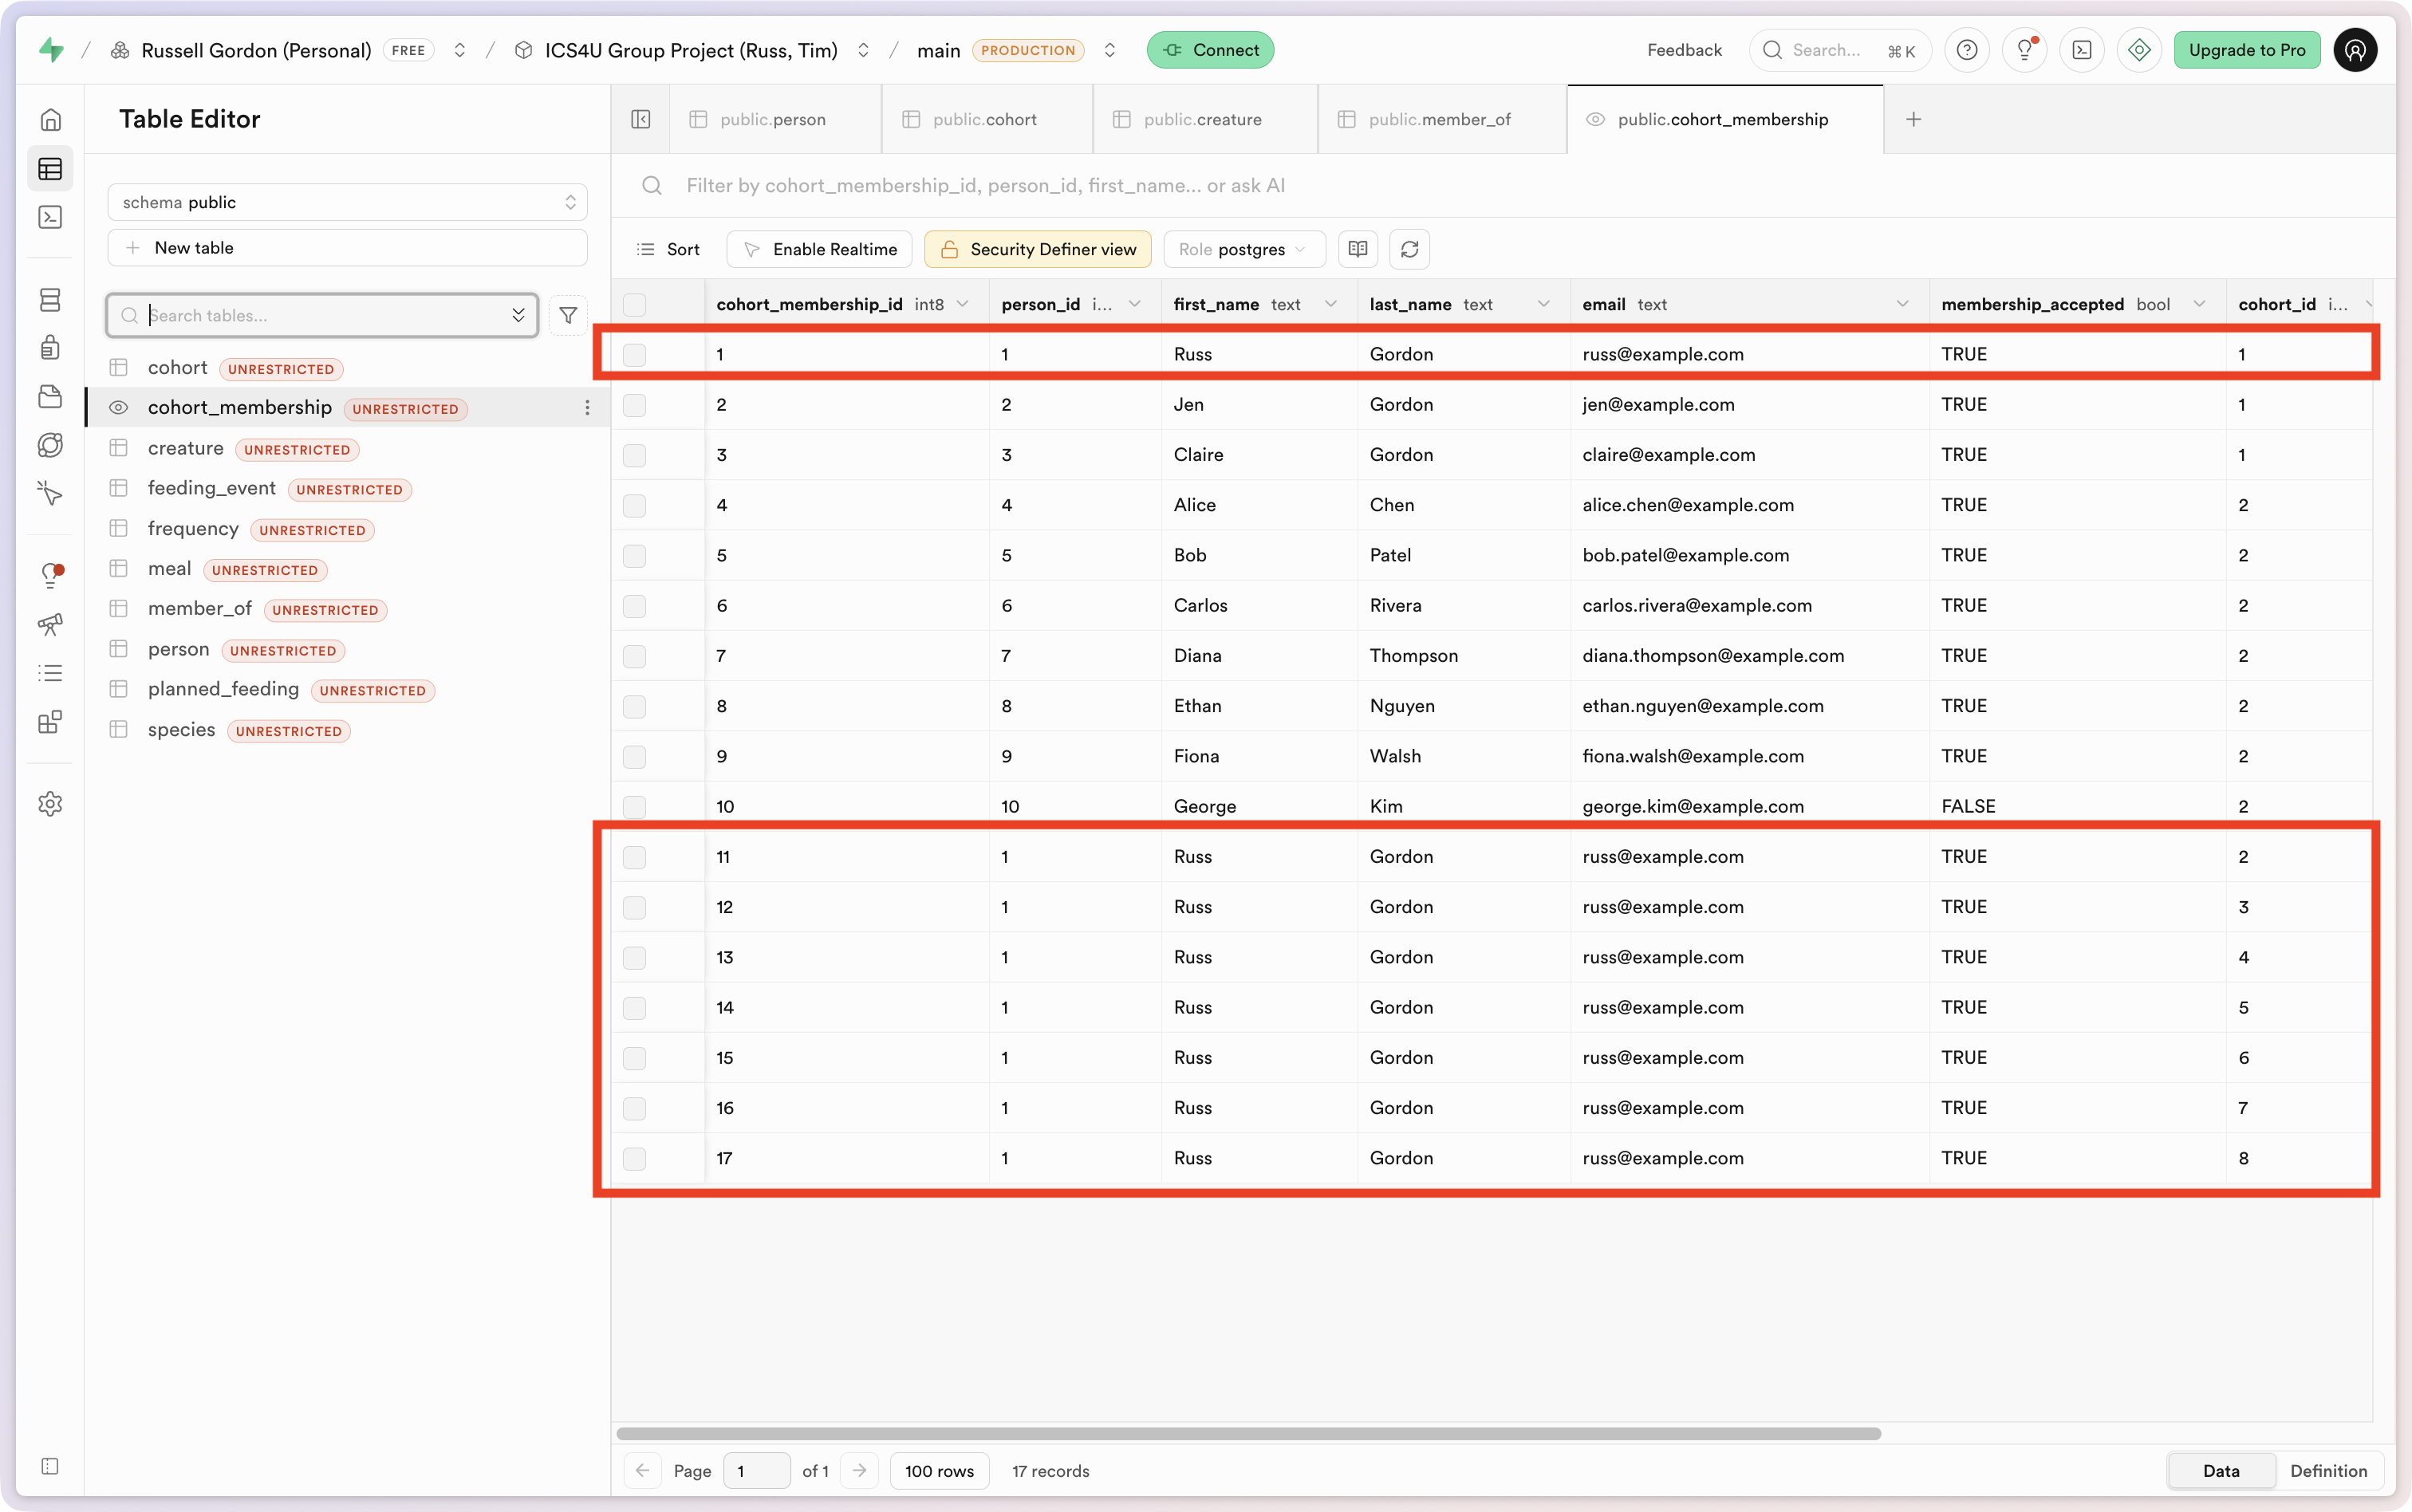
Remember, the database view we wrote retrieves all rows from the joined tables:
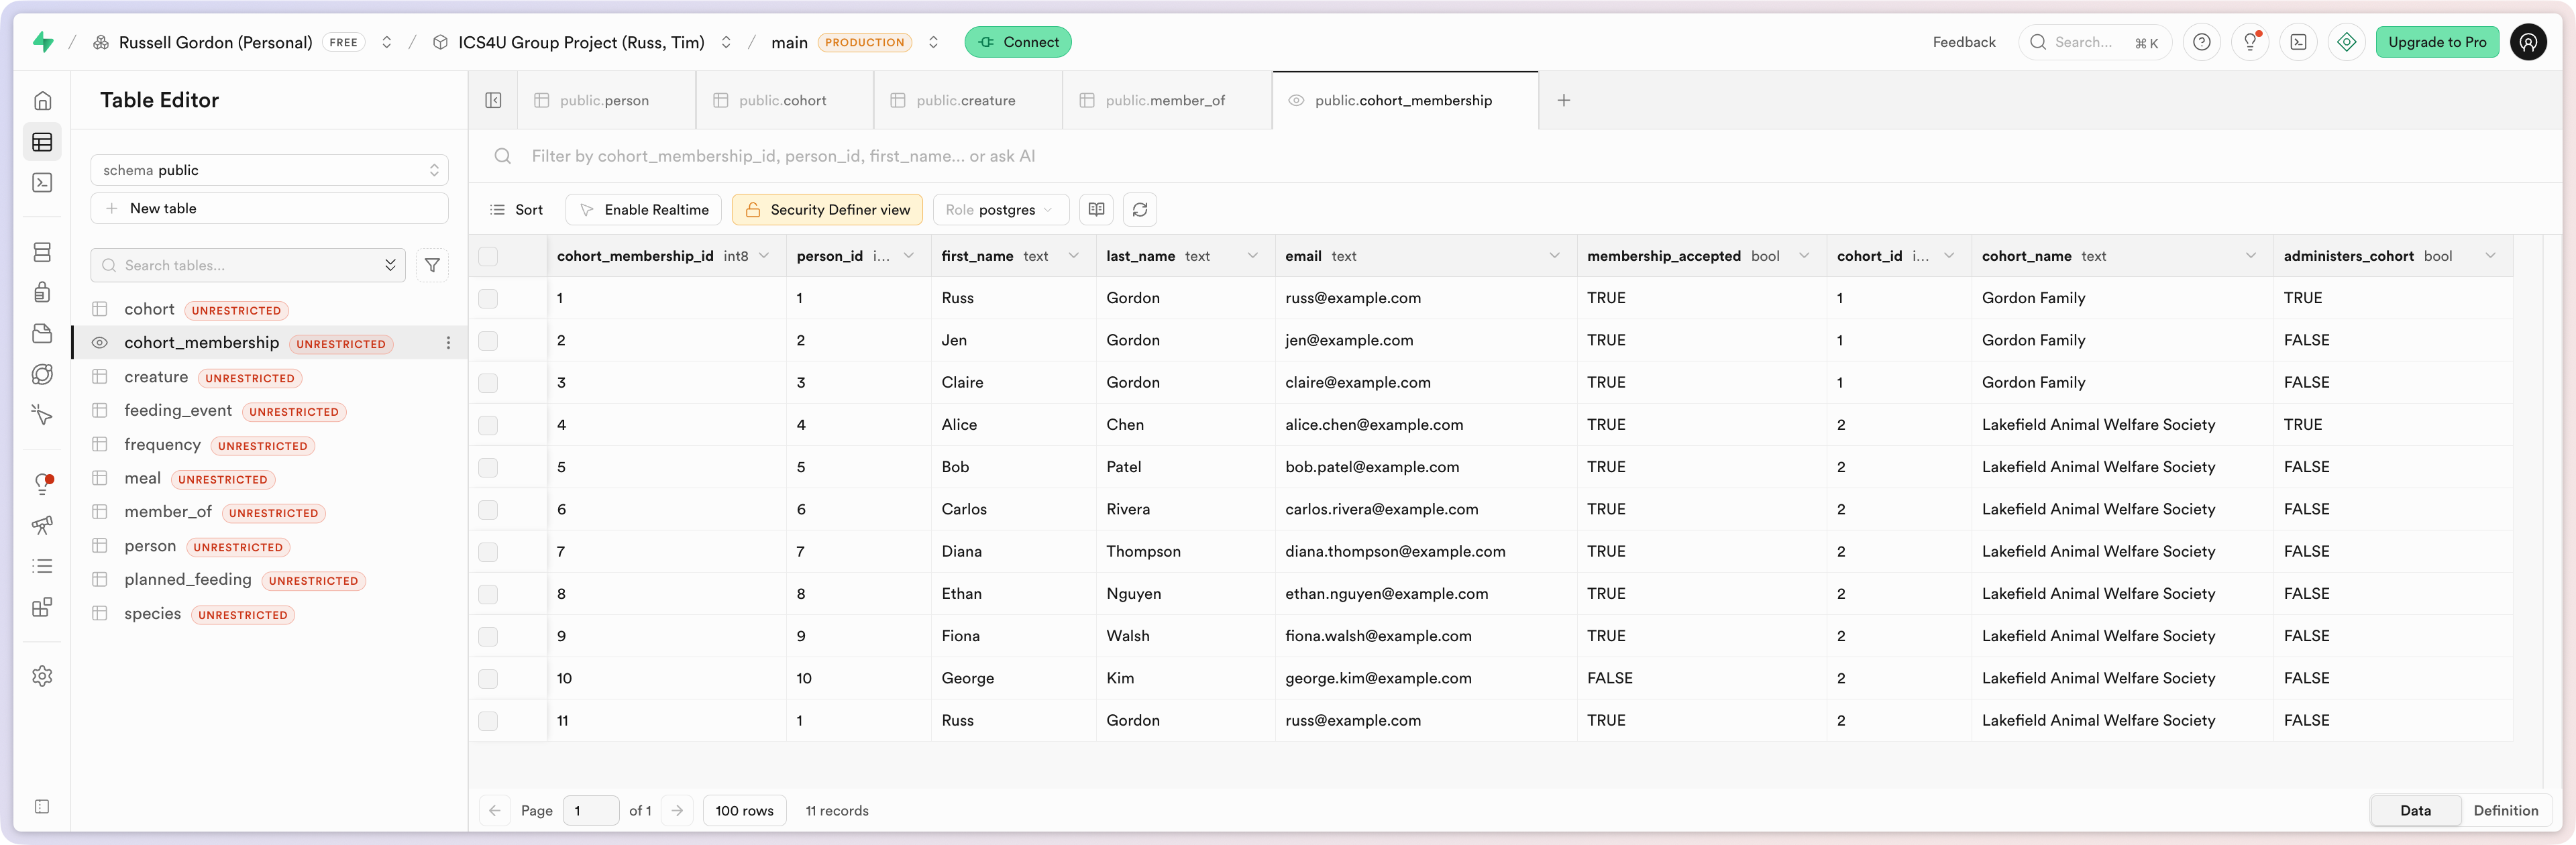
There are 11 rows returned, so the view shows all eleven rows – that is – all the cohorts that all people are a member of.
This is not what we want, of course.
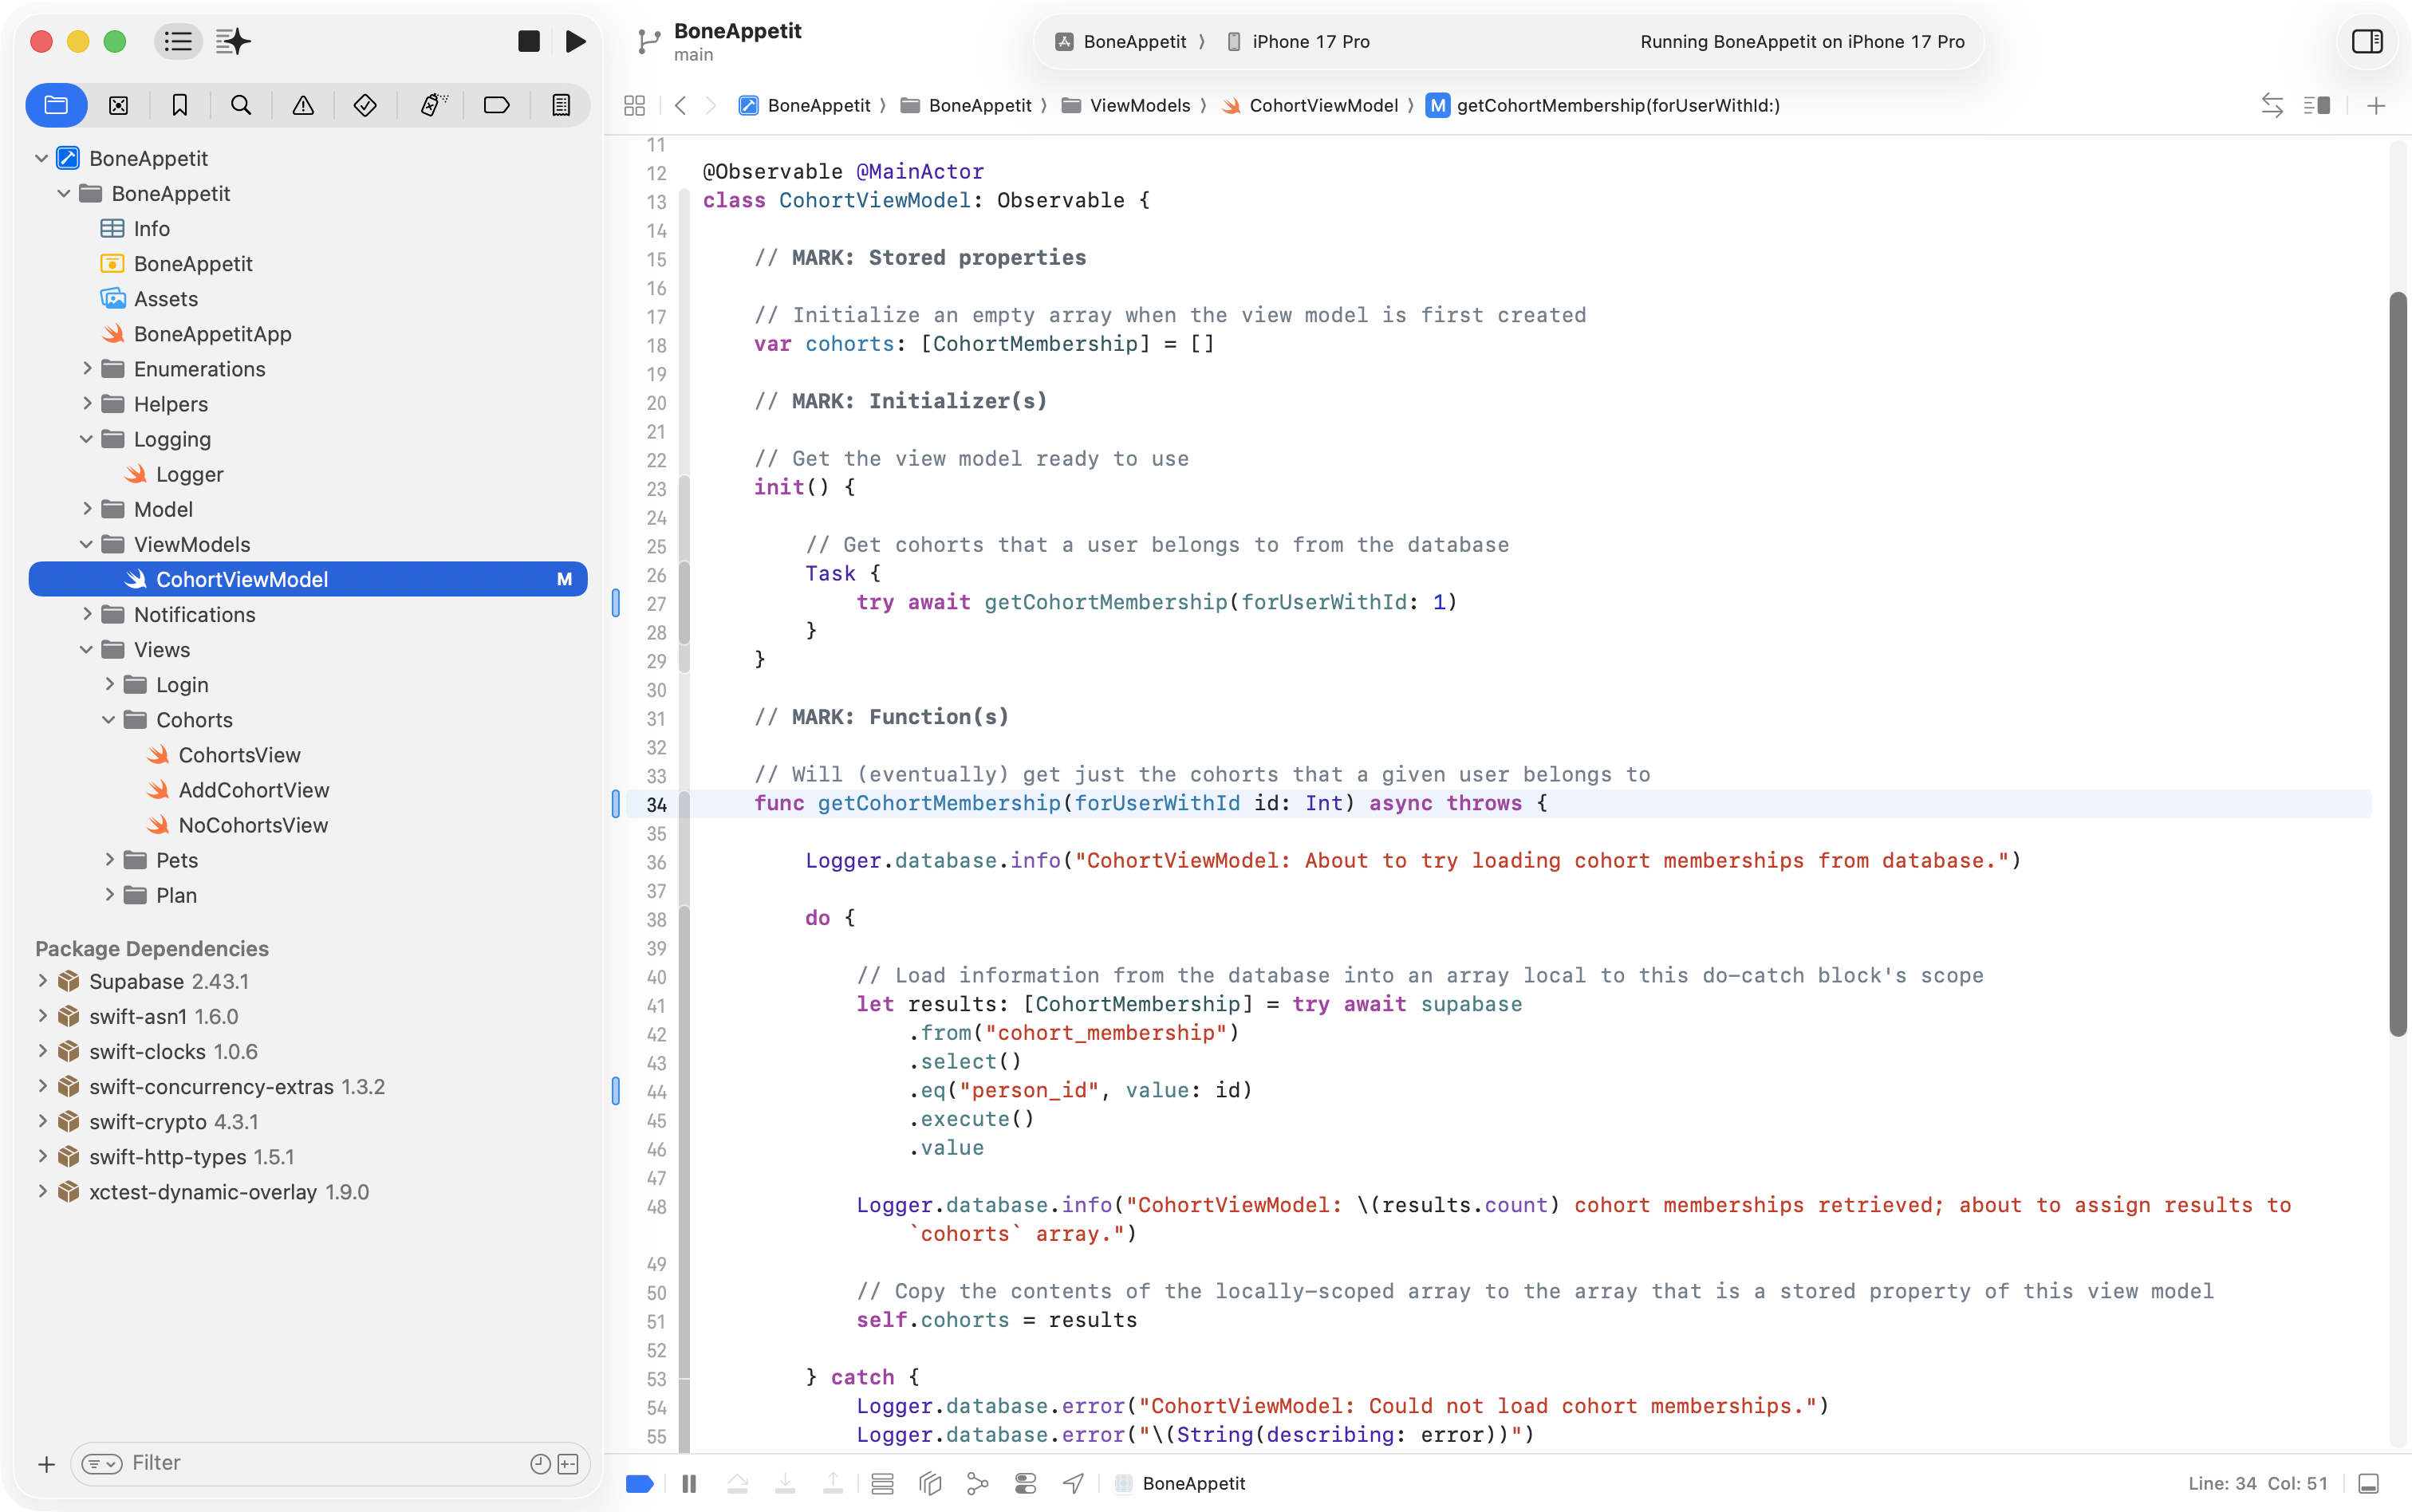
We can temporarily modify the view model so that it retrieves information for just one user – we’ll go with the user that has a person_id of 1. We do this by adding a parameter to the getCohortMembership function:
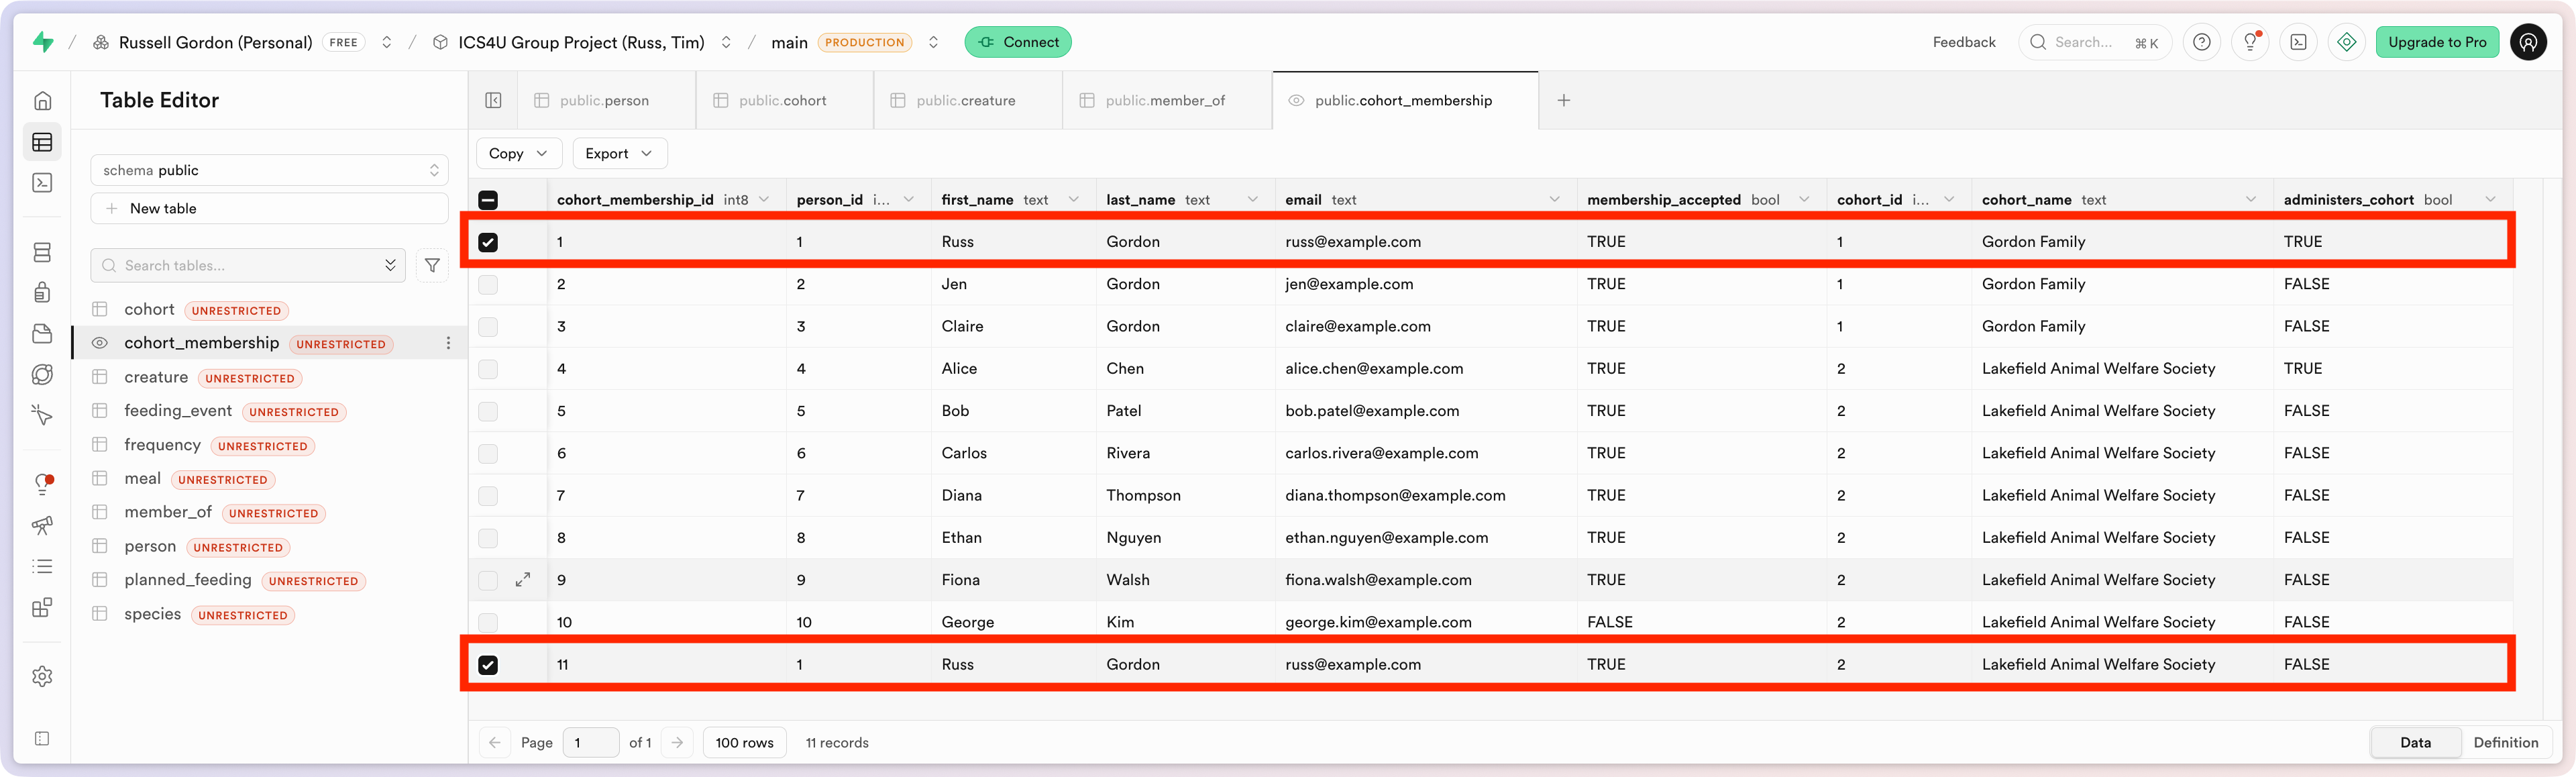
Now, we see the only the cohorts that the user with an id of 1 belongs to:
As seen here in the highlighted rows:
Add more example data
Now in this example so far, there are only two cohorts the user with an id of 1 is a member of.
However, imagine that the person is employed as a dog walker – maybe during their summer vacation!
They might be responsible for feeding many different animals.
They would be a member of many more cohorts.
We can ask the AI tool built into Supabase to create additional sample data – here is the initial prompt that was used:
The purpose of this database is to support an app that tracks when pets are fed by a person who is a member of a cohort. Please review the schema and existing sample data. Please add sample data that expands the number of cohorts that the person with an id of 1 is a member of (imagine they are a dog walker who cares for many different pets from, say, half a dozen families). As needed, please add new creature records to describe additional pets. Can you please generate the SQL required to add this sample data to the databse, in the form of a transaction?
Here is the code the AI produced:
-- Add more sample data
BEGIN;
WITH new_cohorts AS (
INSERT INTO public.cohort (name)
VALUES
('Alvarez Family'),
('Chen Family'),
('Patel Family'),
('Johnson Family'),
('Nguyen Family'),
('Wilson Family')
RETURNING id, name
),
new_memberships AS (
INSERT INTO public.member_of (
person_id,
cohort_id,
is_membership_accepted,
is_membership_paused,
administers,
date_left
)
SELECT
1 AS person_id,
nc.id AS cohort_id,
TRUE AS is_membership_accepted,
FALSE AS is_membership_paused,
FALSE AS administers,
NULL AS date_left
FROM new_cohorts nc
RETURNING id, person_id, cohort_id
),
inserted_creatures AS (
INSERT INTO public.creature (
name,
date_of_birth,
date_of_passing,
species_id,
cohort_id
)
SELECT
pets.pet_name,
pets.dob,
NULL::timestamptz AS date_of_passing,
sp.id AS species_id,
nc.id AS cohort_id
FROM new_cohorts nc
JOIN (
VALUES
(1, 'Milo', '2019-04-12T00:00:00Z'::timestamptz, 'Dog'),
(1, 'Luna', '2017-09-03T00:00:00Z'::timestamptz, 'Cat'),
(2, 'Rocky', '2020-01-20T00:00:00Z'::timestamptz, 'Dog'),
(2, 'Socks', '2018-06-25T00:00:00Z'::timestamptz, 'Cat'),
(3, 'Bella', '2016-11-05T00:00:00Z'::timestamptz, 'Dog'),
(3, 'Whiskers','2015-02-14T00:00:00Z'::timestamptz, 'Cat'),
(4, 'Charlie','2019-08-30T00:00:00Z'::timestamptz, 'Dog'),
(4, 'Nori', '2021-03-09T00:00:00Z'::timestamptz, 'Cat'),
(5, 'Daisy', '2018-12-18T00:00:00Z'::timestamptz, 'Dog'),
(5, 'Pepper', '2022-05-01T00:00:00Z'::timestamptz, 'Cat'),
(6, 'Max', '2017-07-07T00:00:00Z'::timestamptz, 'Dog'),
(6, 'Olive', '2020-10-10T00:00:00Z'::timestamptz, 'Cat')
) AS pets(cohort_sequence, pet_name, dob, species_common_name)
ON pets.cohort_sequence = (
SELECT t.cohort_sequence
FROM (
SELECT id, row_number() OVER (ORDER BY id) AS cohort_sequence
FROM new_cohorts
) t
WHERE t.id = nc.id
)
JOIN public.species sp
ON sp.common_name = pets.species_common_name
RETURNING id
)
SELECT
(SELECT COUNT(*) FROM new_cohorts) AS added_cohorts,
(SELECT COUNT(*) FROM new_memberships) AS added_memberships,
(SELECT COUNT(*) FROM inserted_creatures) AS added_creatures;
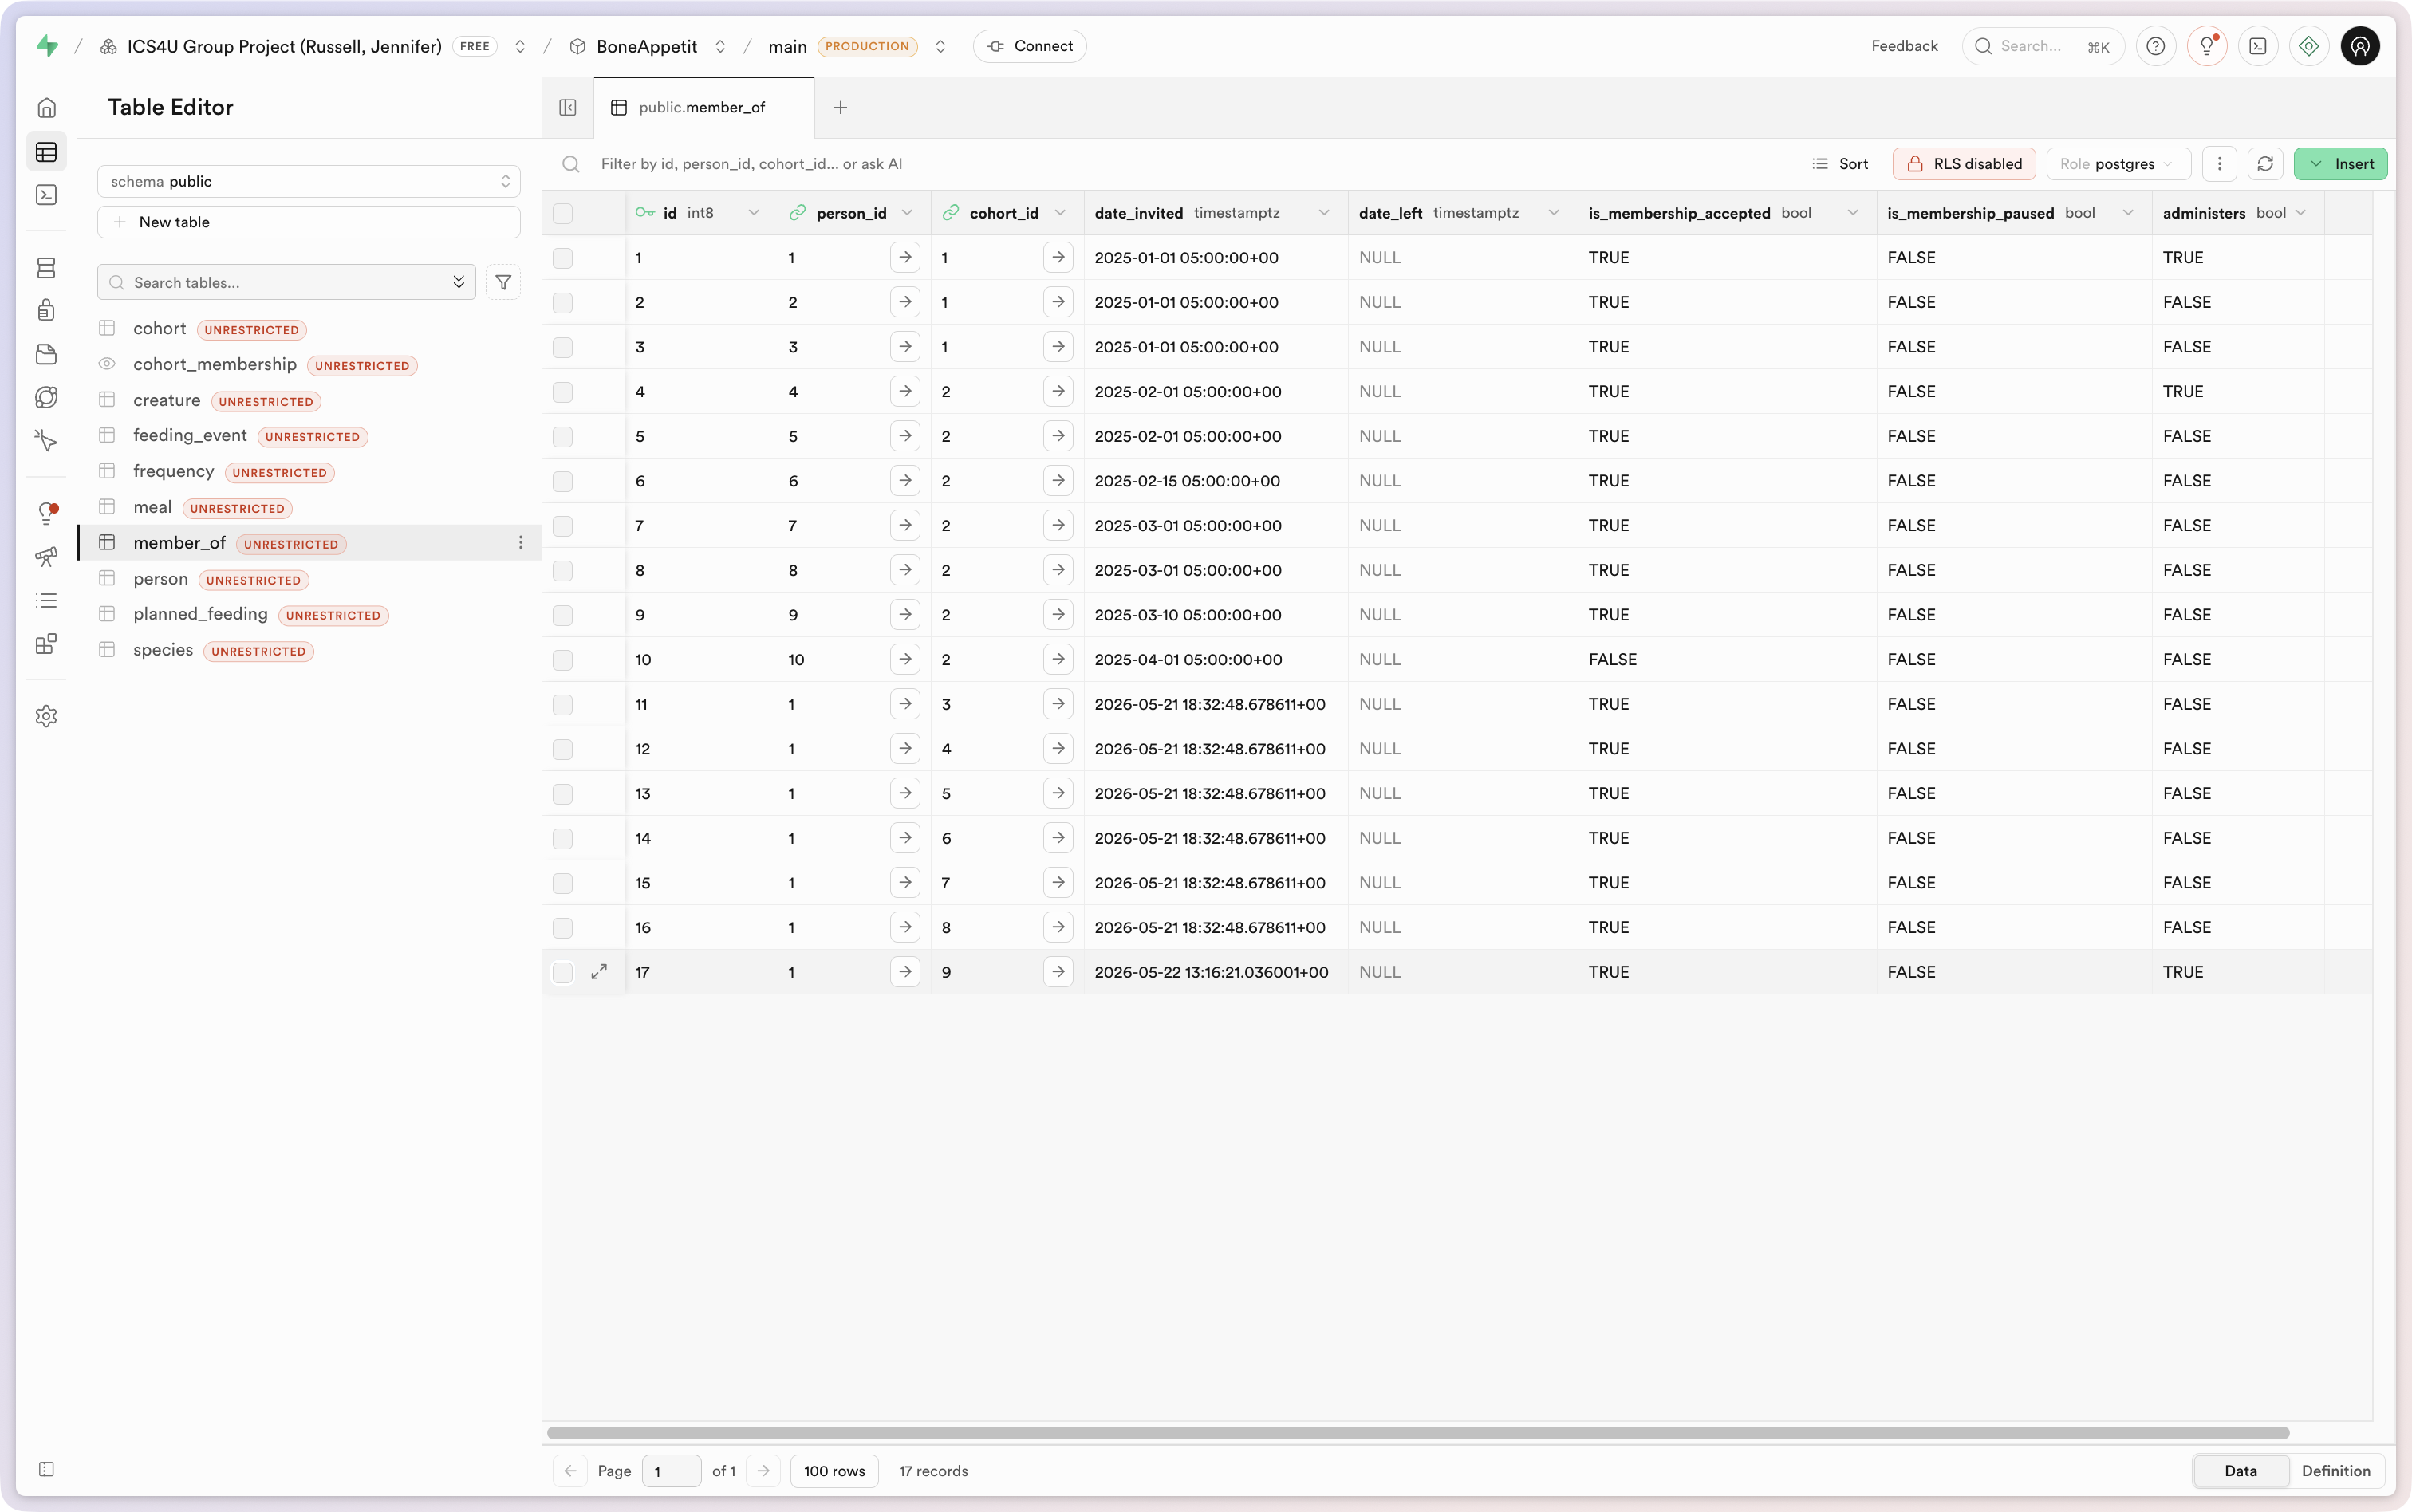
COMMIT;After running that code in the SQL editor window at Supabase, we see that the user with an id of 1 is a member of many more cohorts:
When we re-run the app, we see that reflected in the user interface:
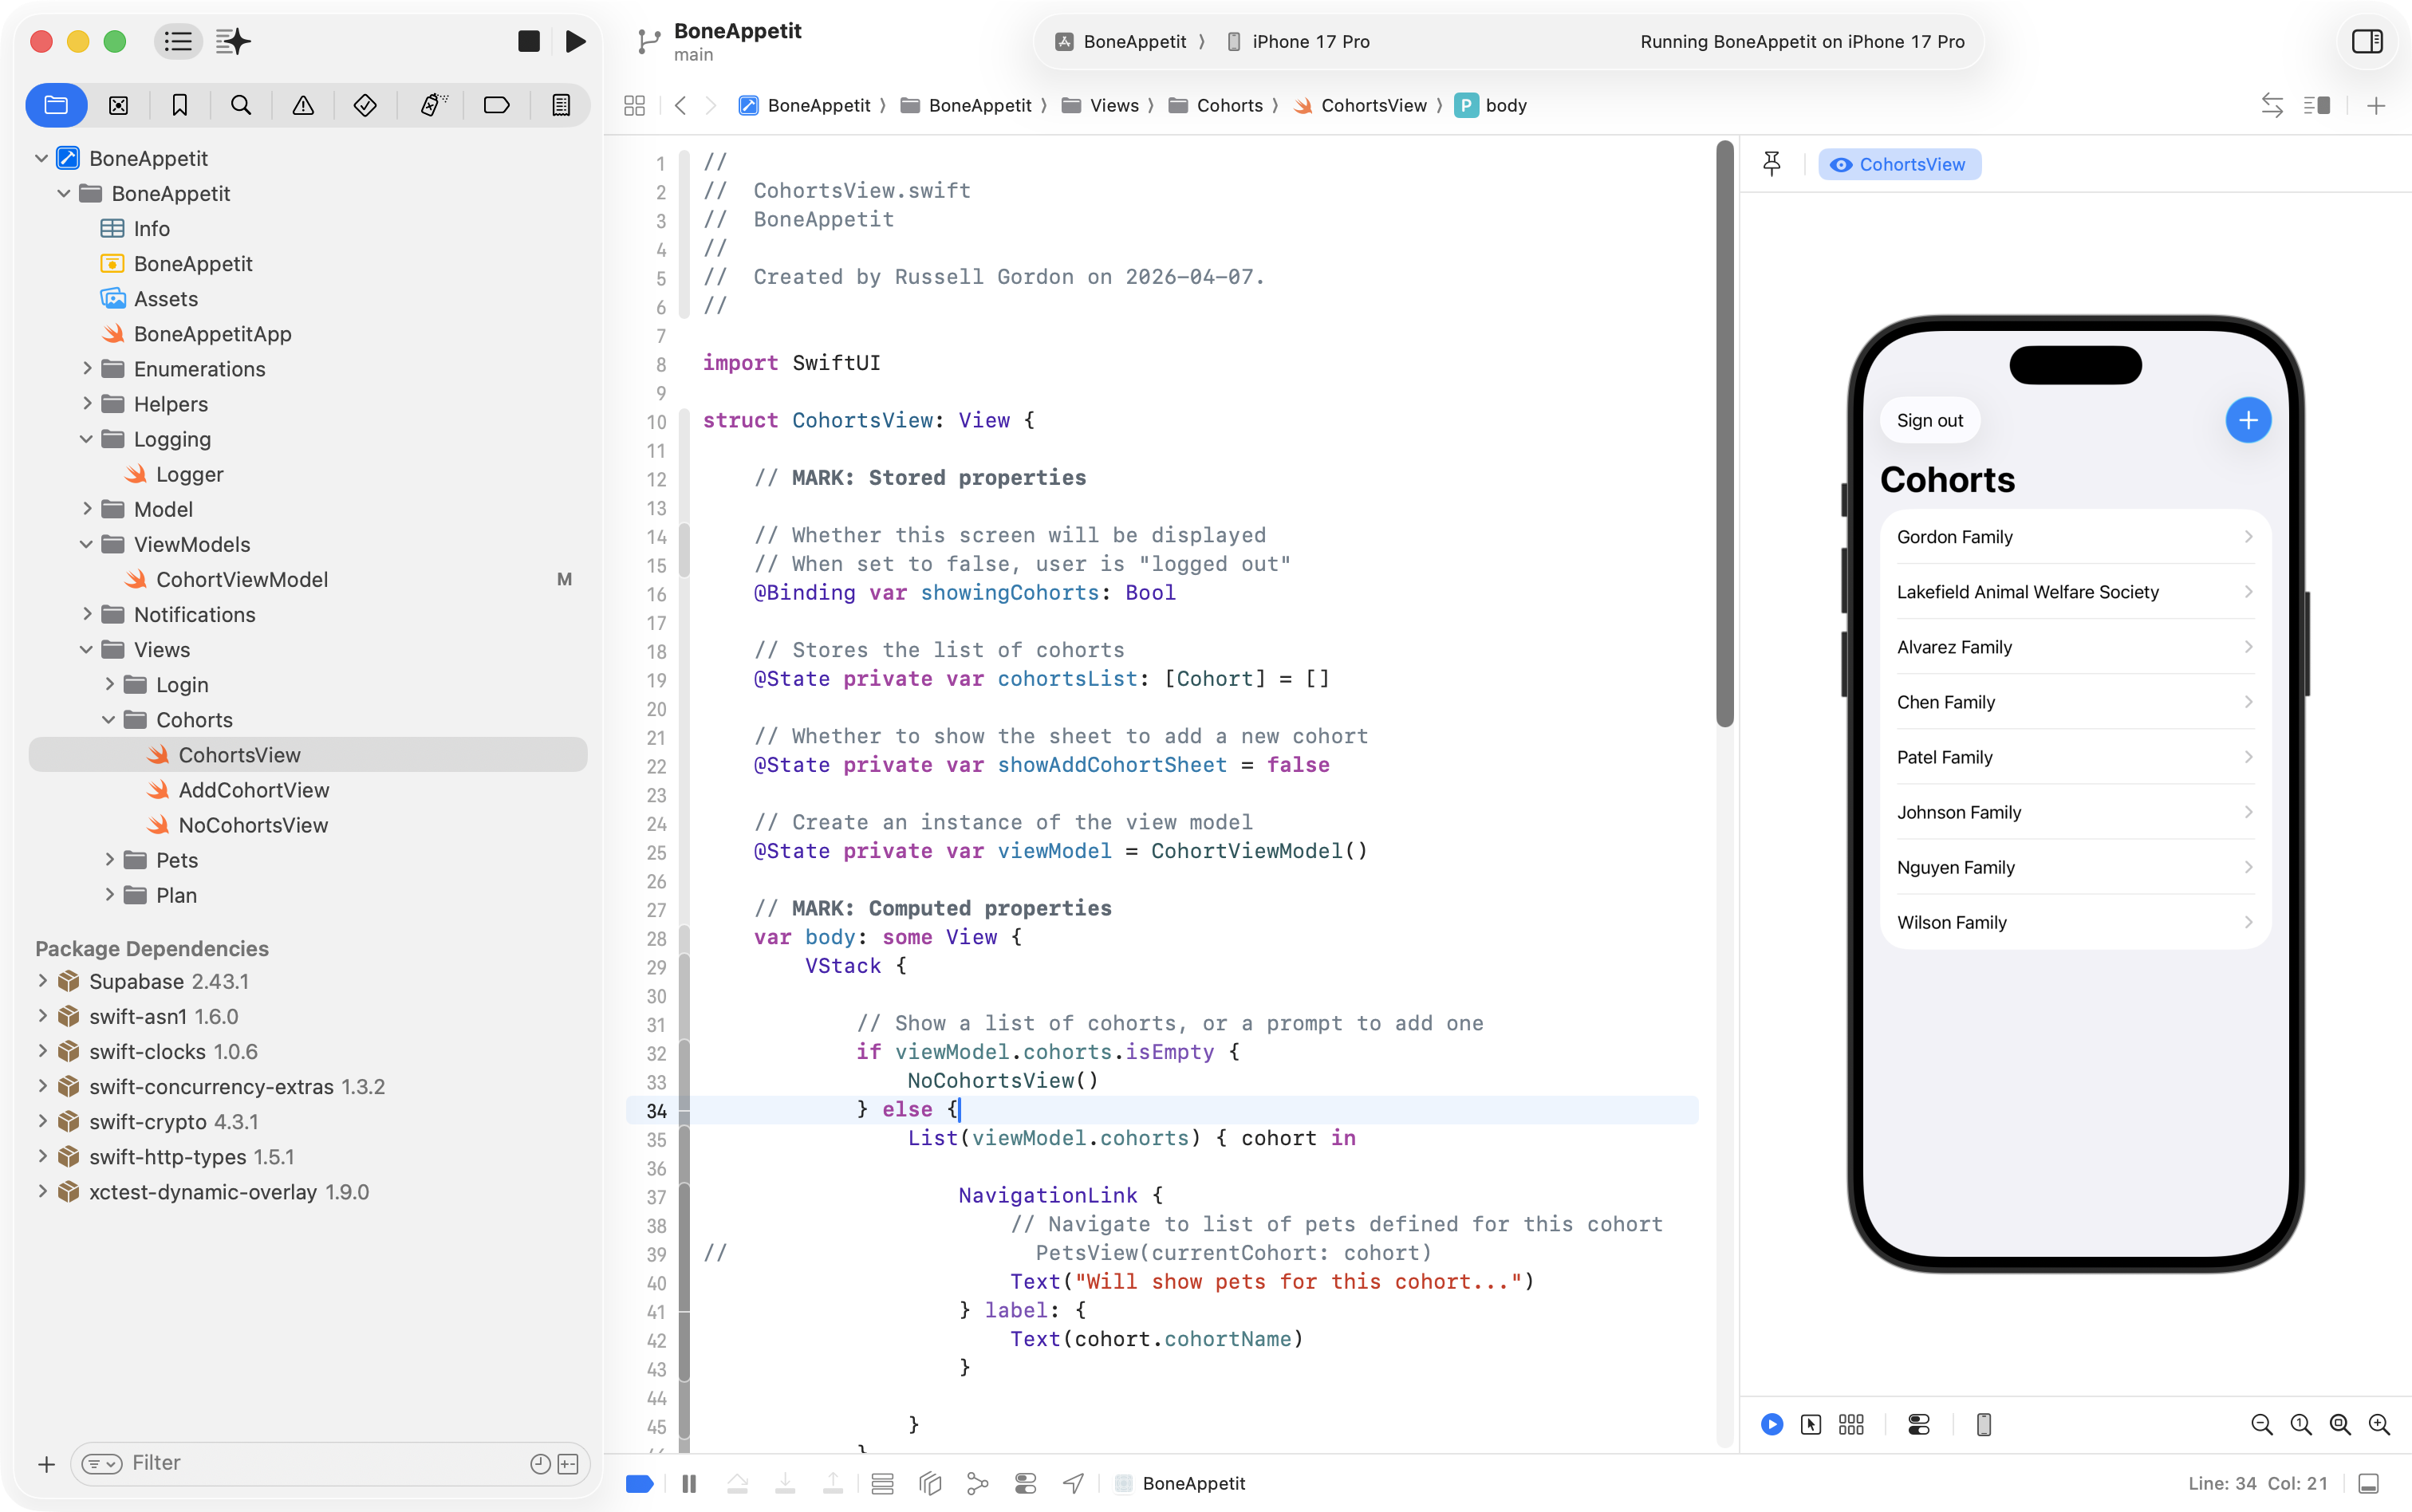
Manipulate arrays using a function
Now that there are so many cohorts a user is a member of, they may want to filter the list of cohorts using a search bar in the user interface.
There are several ways to do this, but one way is to write a function.
The input to the function would be:
- The array to be filtered
- What text to filter the array on.
The processing steps of the function would be, in pseudo-code:
- Is the string to filter on an empty string?
- If so, return the original array, with no filtering.
- If not…
- Create an empty array to hold matching values.
- Iterate over the elements of the array to be filtered.
- When an element in the array contains the text to be filtered on, add it to the filtered array.
- Return the filtered array.
The output of the function is either the original array, or a filtered array.
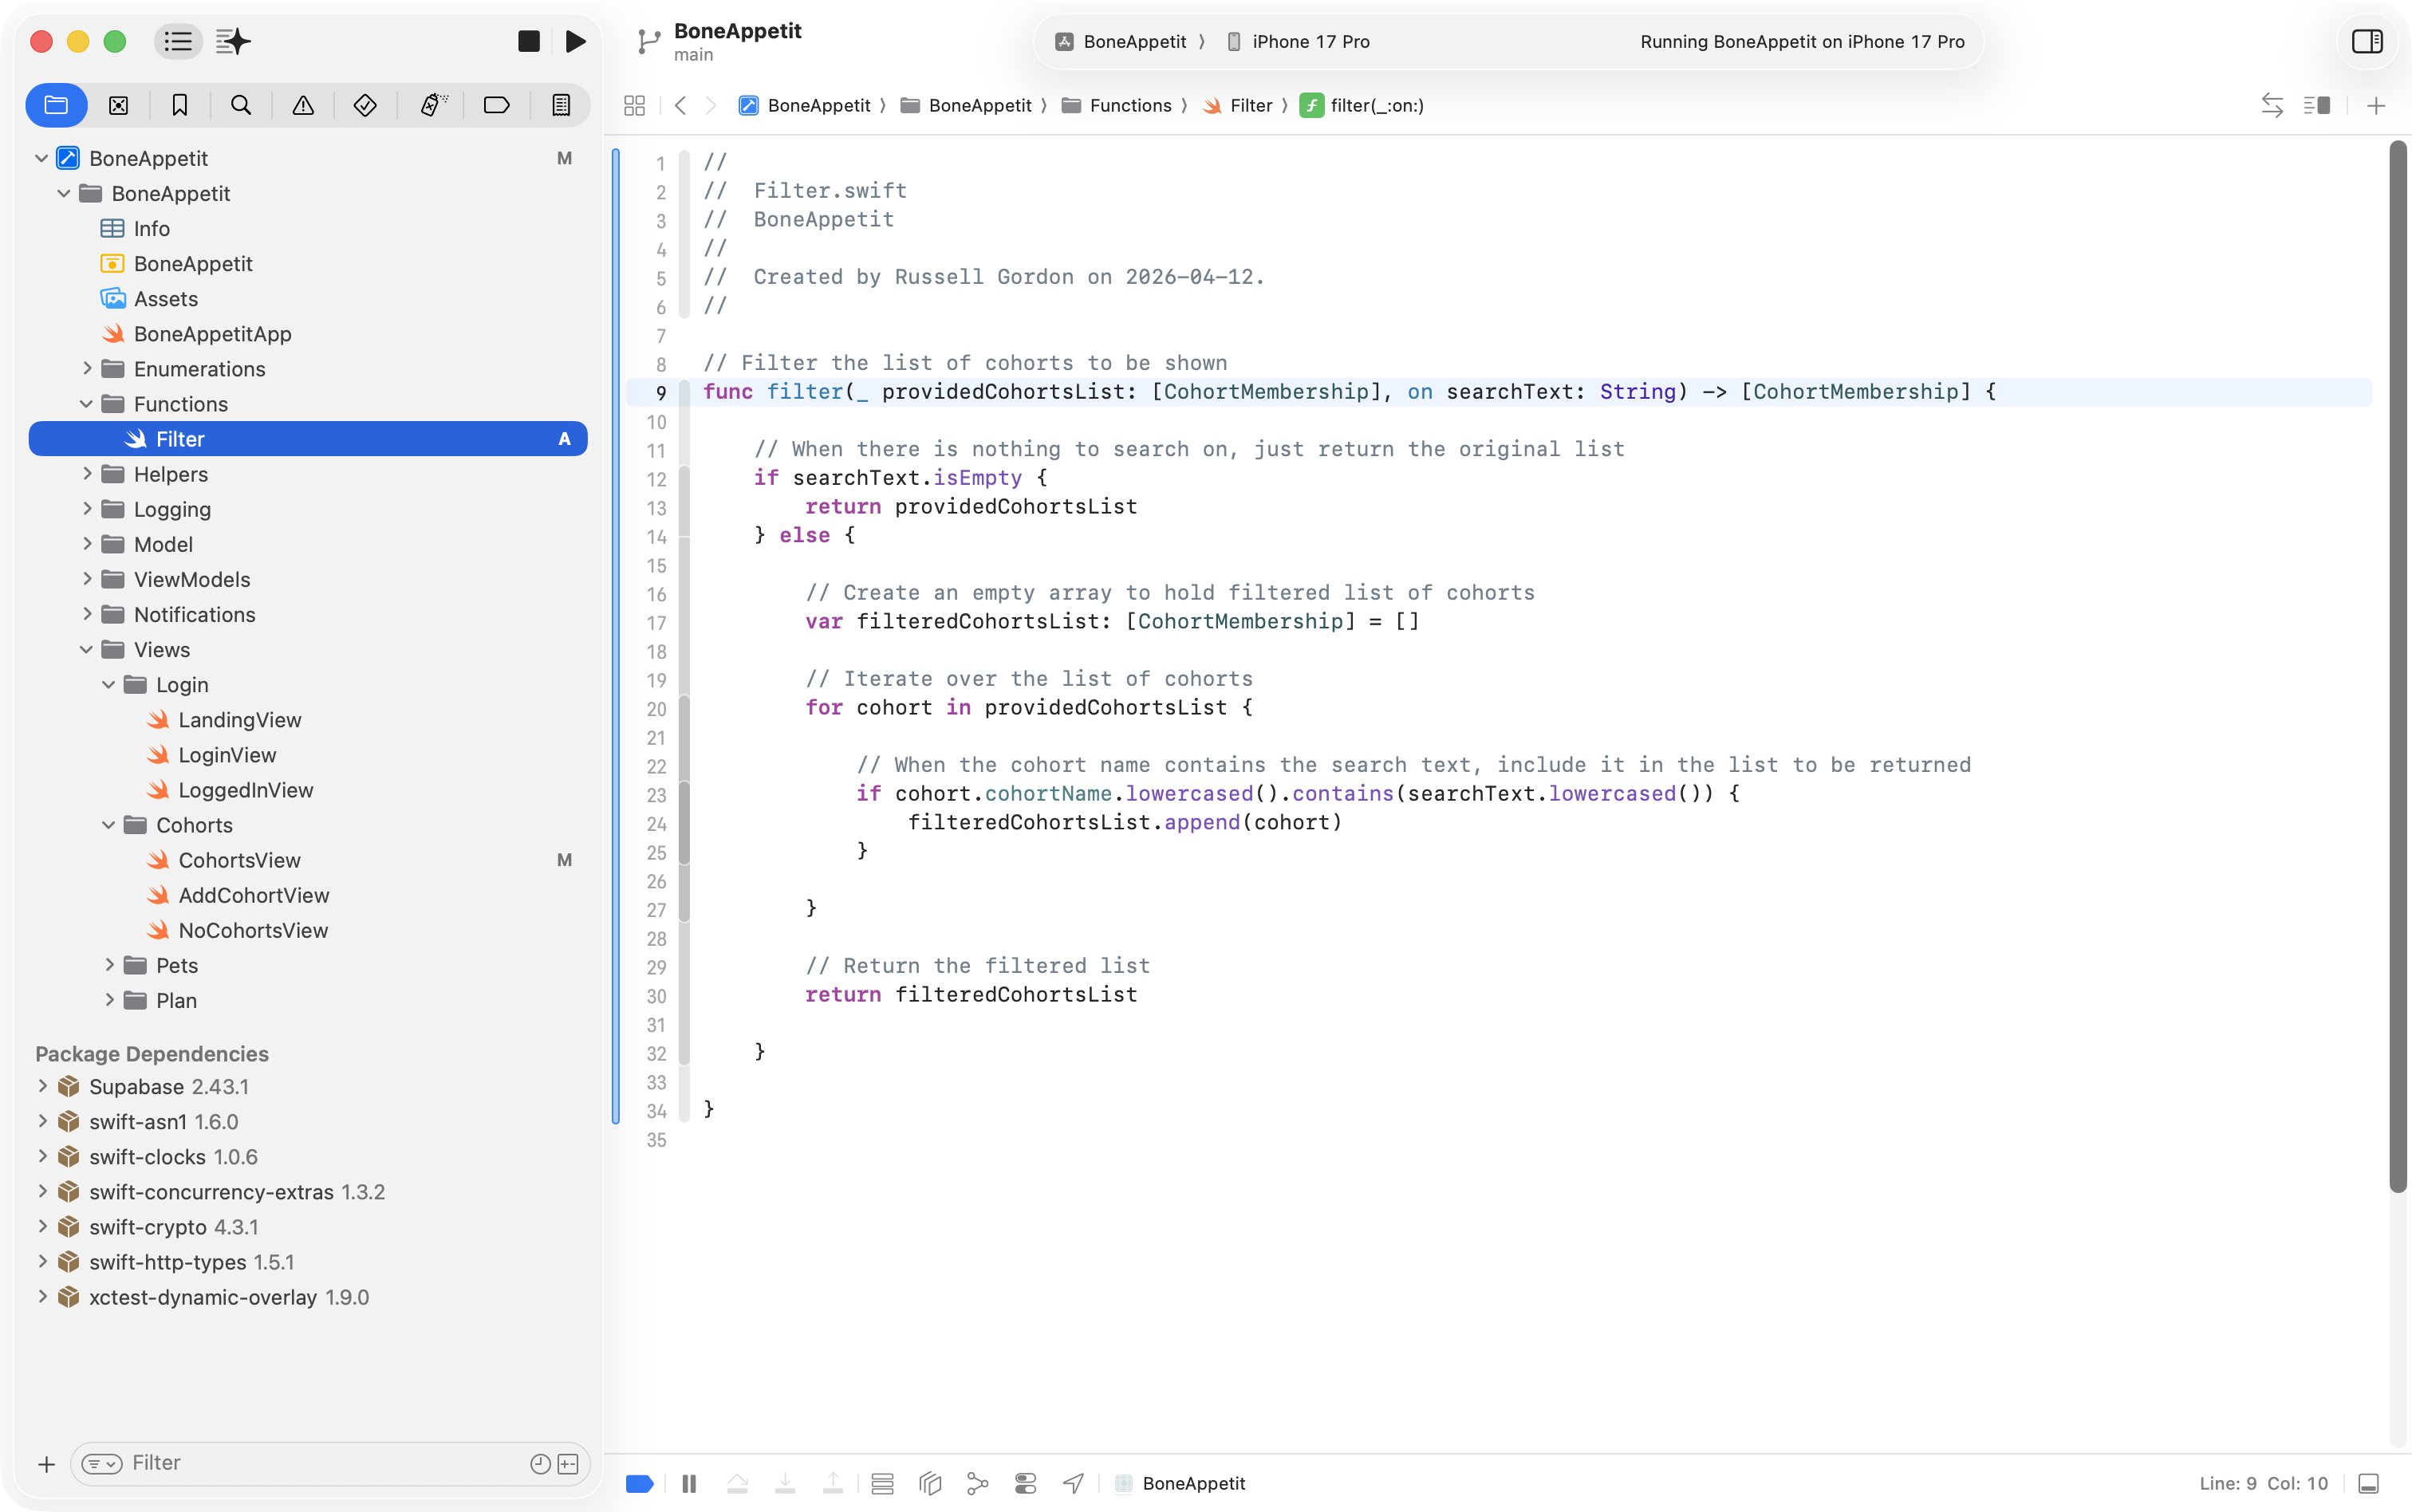
In Swift code, this looks like:
// Filter the list of cohorts to be shown
func filter(_ providedCohortsList: [CohortMembership], on searchText: String) -> [CohortMembership] {

    // When there is nothing to search on, just return the original list
    if searchText.isEmpty {
        return providedCohortsList
    } else {

        // Create an empty array to hold filtered list of cohorts
        var filteredCohortsList: [CohortMembership] = []

        // Iterate over the list of cohorts
        for cohort in providedCohortsList {

            // When the cohort name contains the search text, include it in the list to be returned
            if cohort.cohortName.lowercased().contains(searchText.lowercased()) {
                filteredCohortsList.append(cohort)
            }

        }

        // Return the filtered list
        return filteredCohortsList

    }

}
We can add the function to a new group in the project:
To use the function, we add the following code to our view:
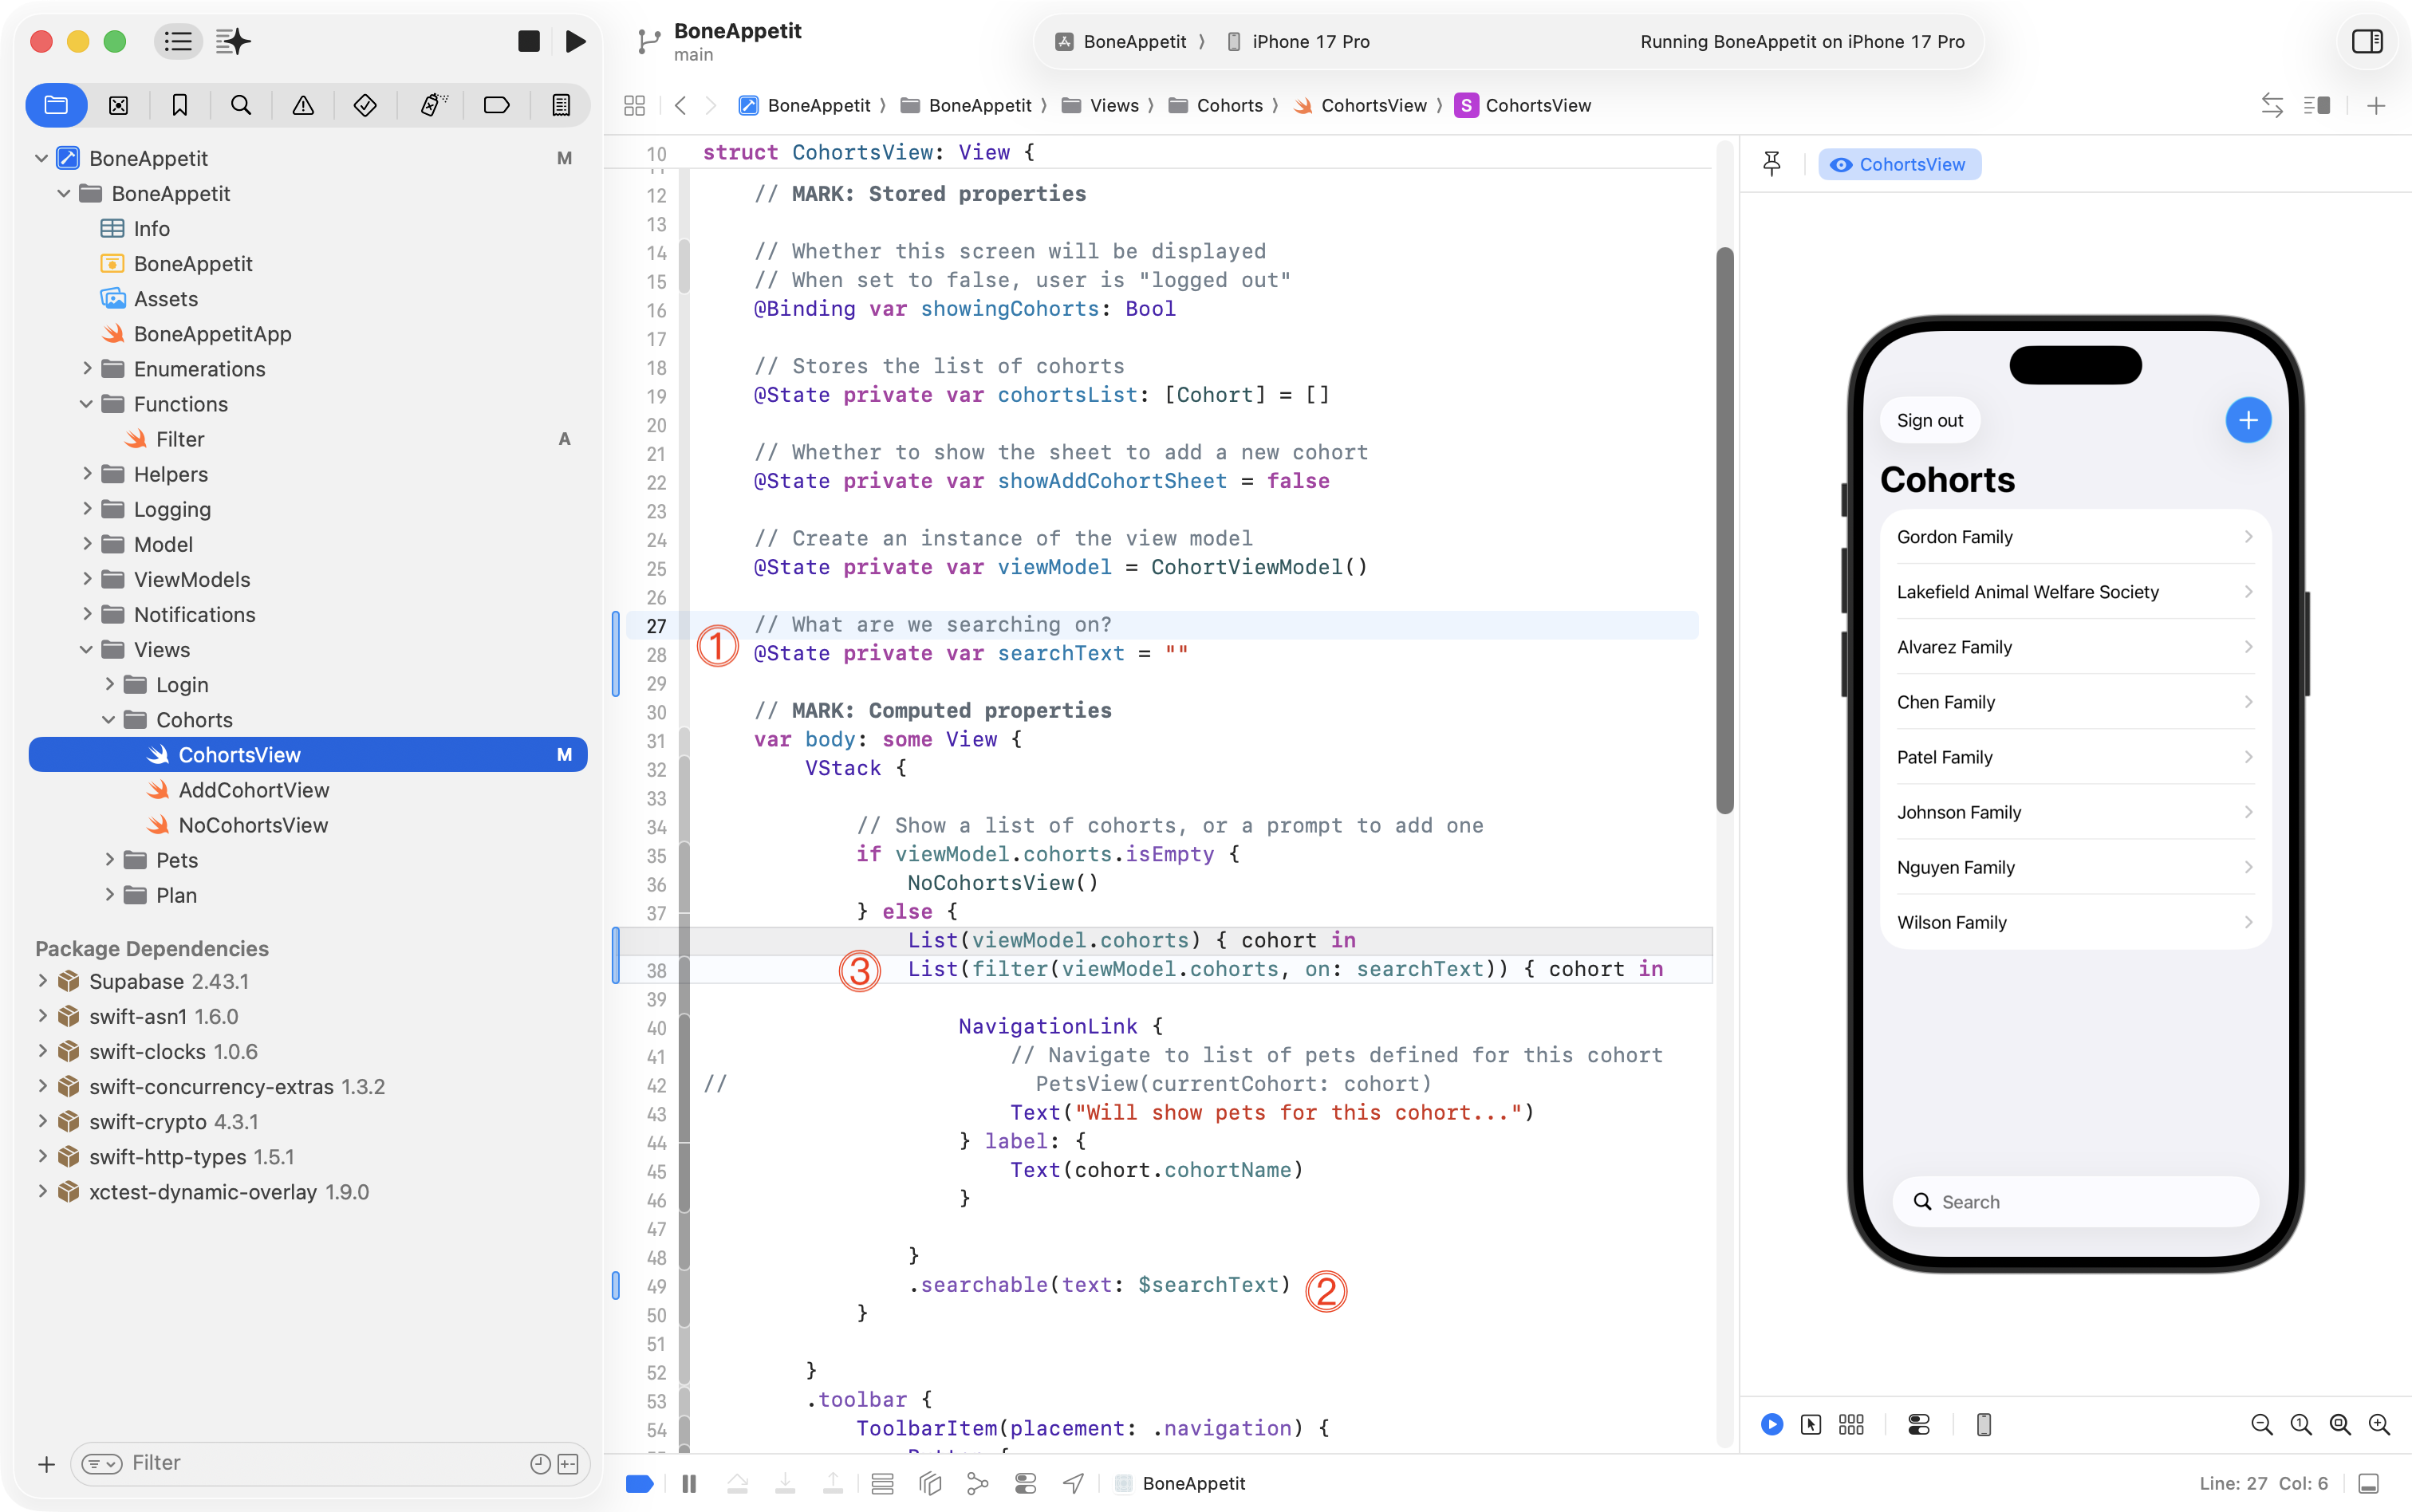
DISCUSSION
Let’s review what is happening in the view:
- We create a stored property to hold the text the user types into the search bar.
- We use the
.searchableview modifier to create the search bar the user types into.- Rather that iterating over the
cohortsarray from the view model directly (the old code, in grey) we now invoke thefilterfunction, pass in thecohortsarray from the view model and the currentsearchText, and display in the scrollable list in the user interface the filtered array that is returned from the function.
Here is what this looks like in the form of a video:
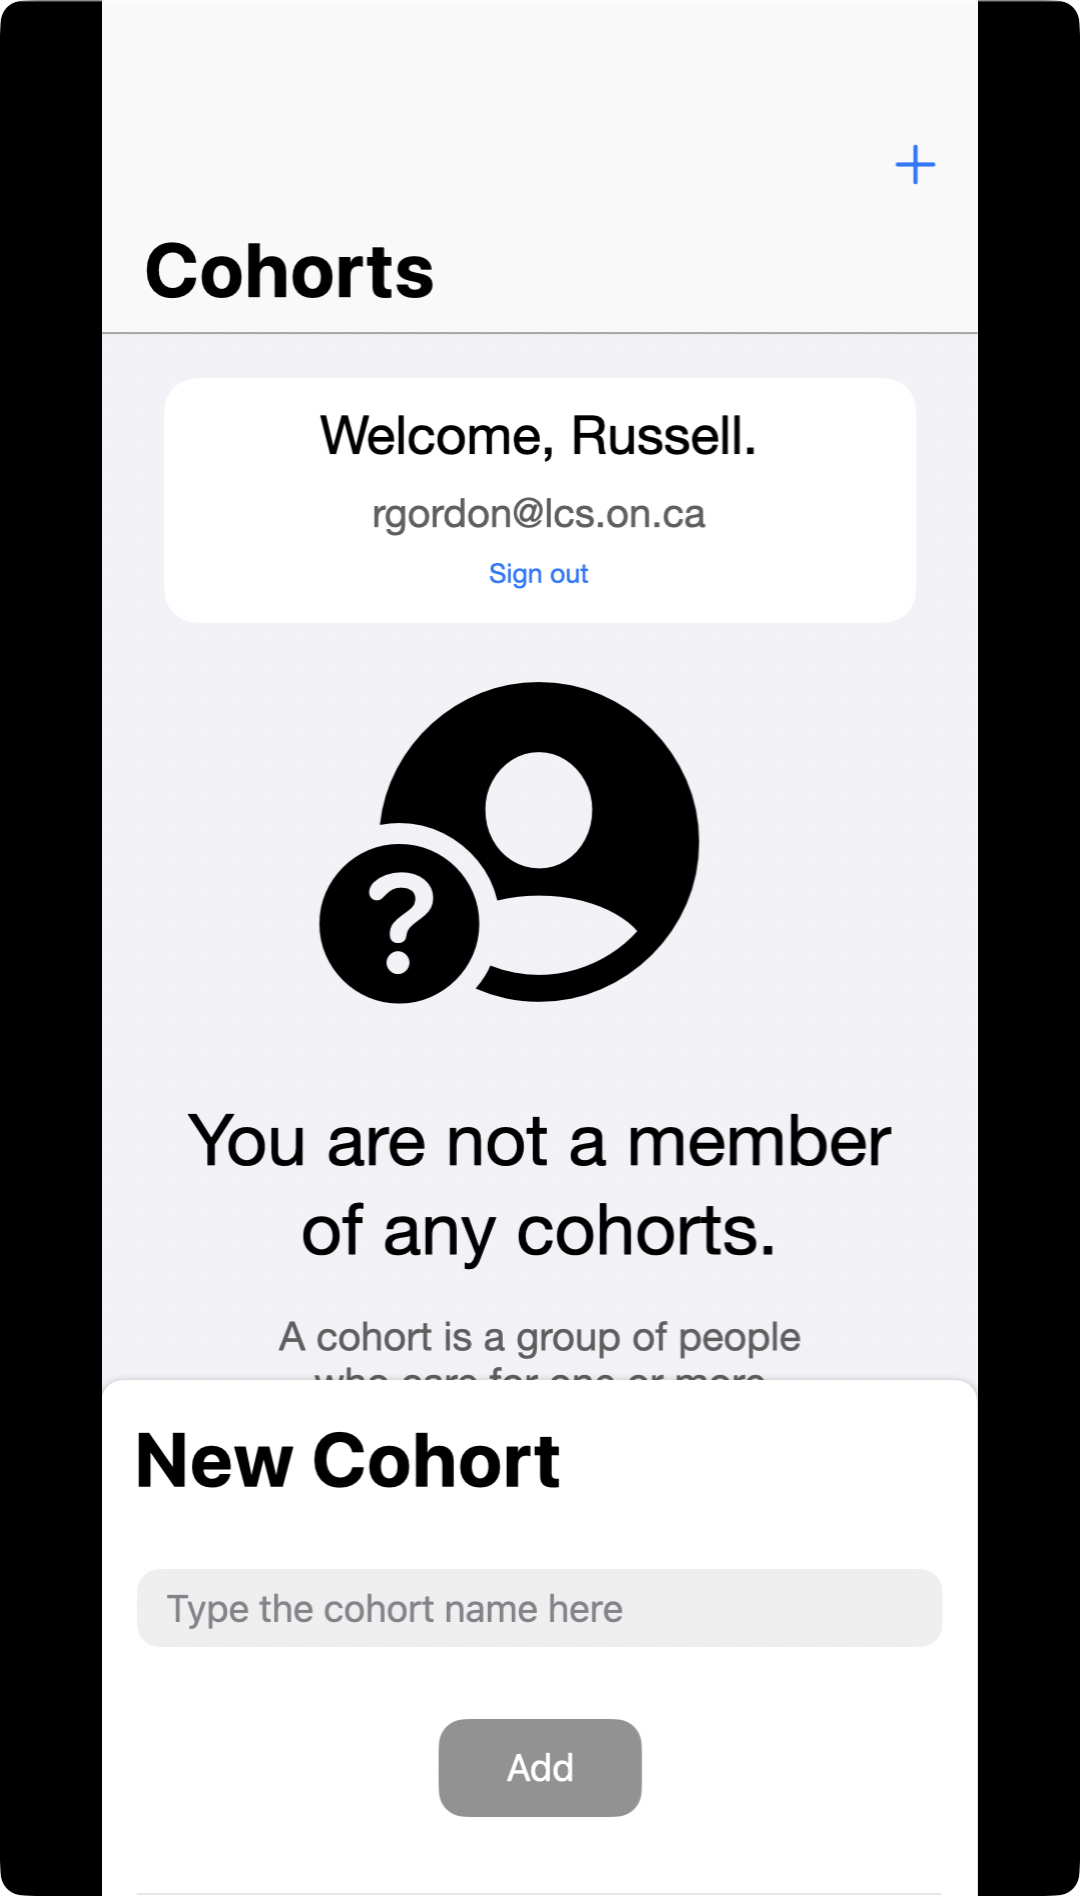
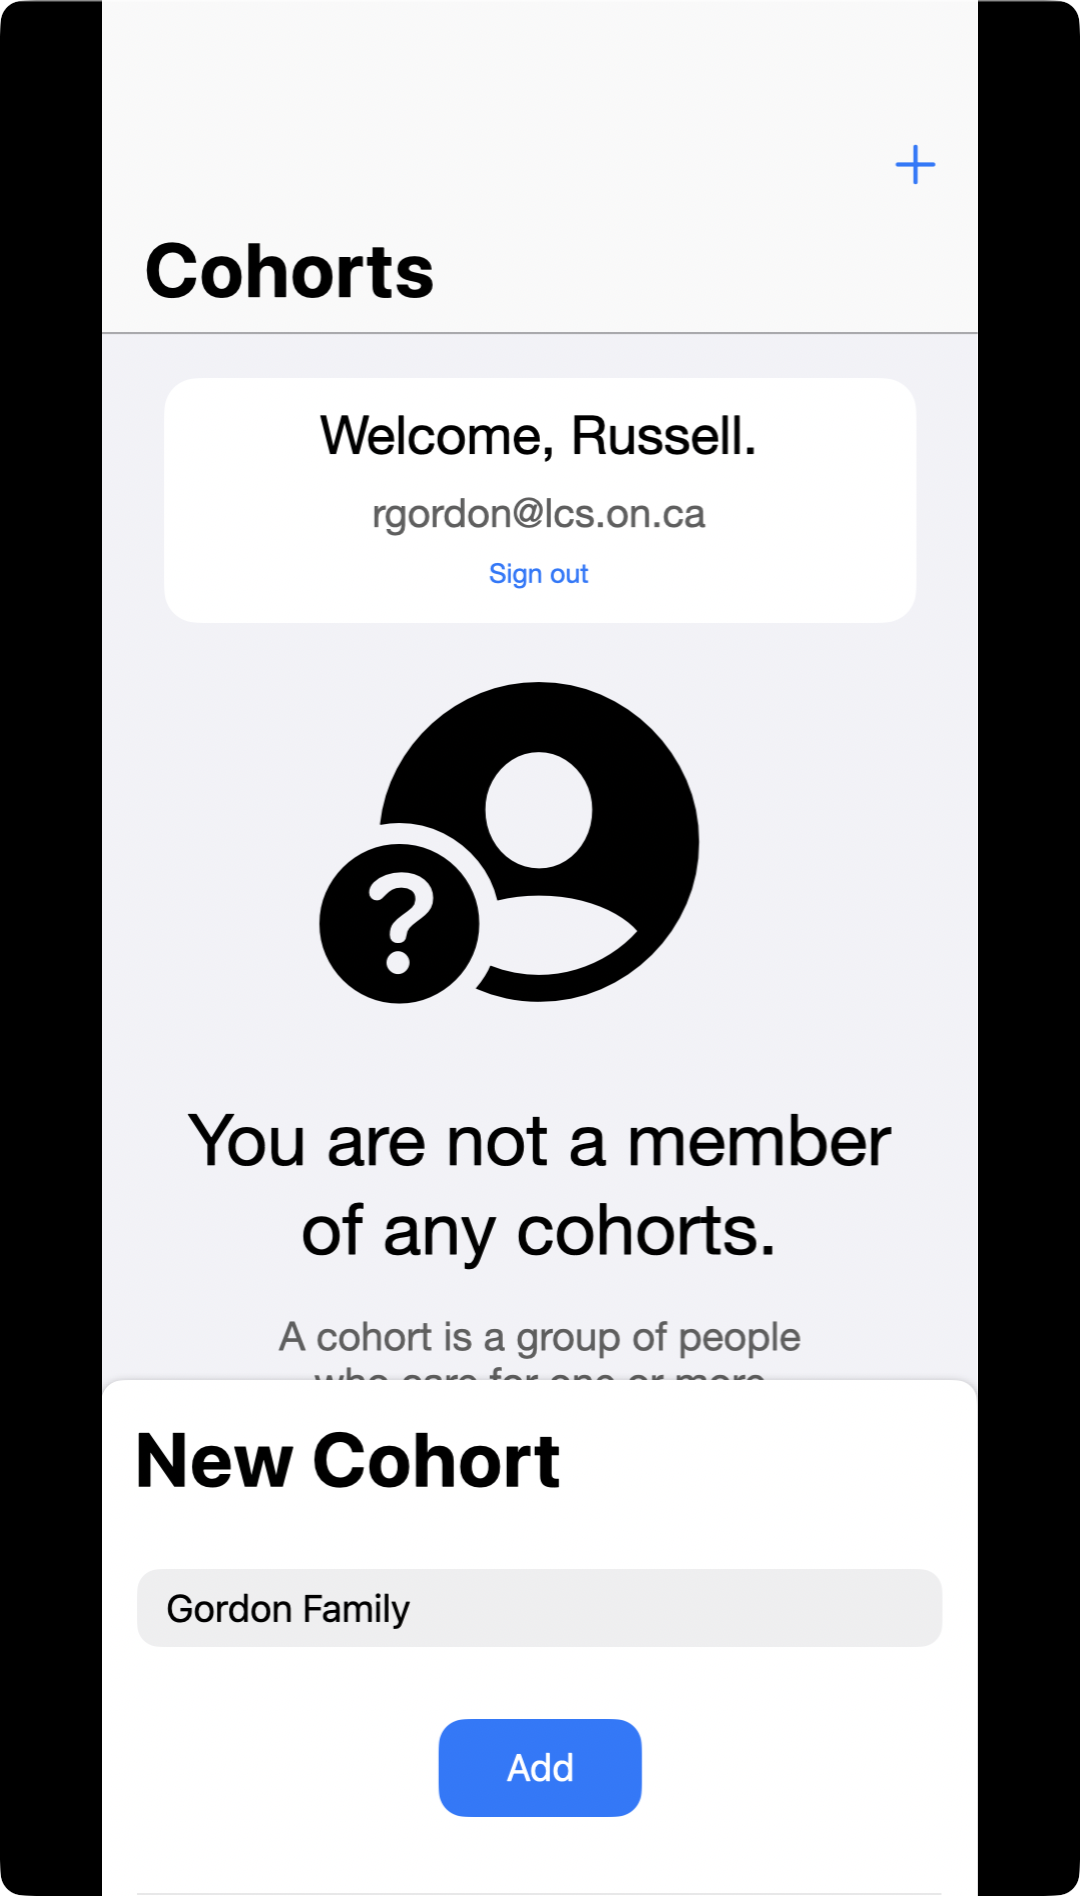
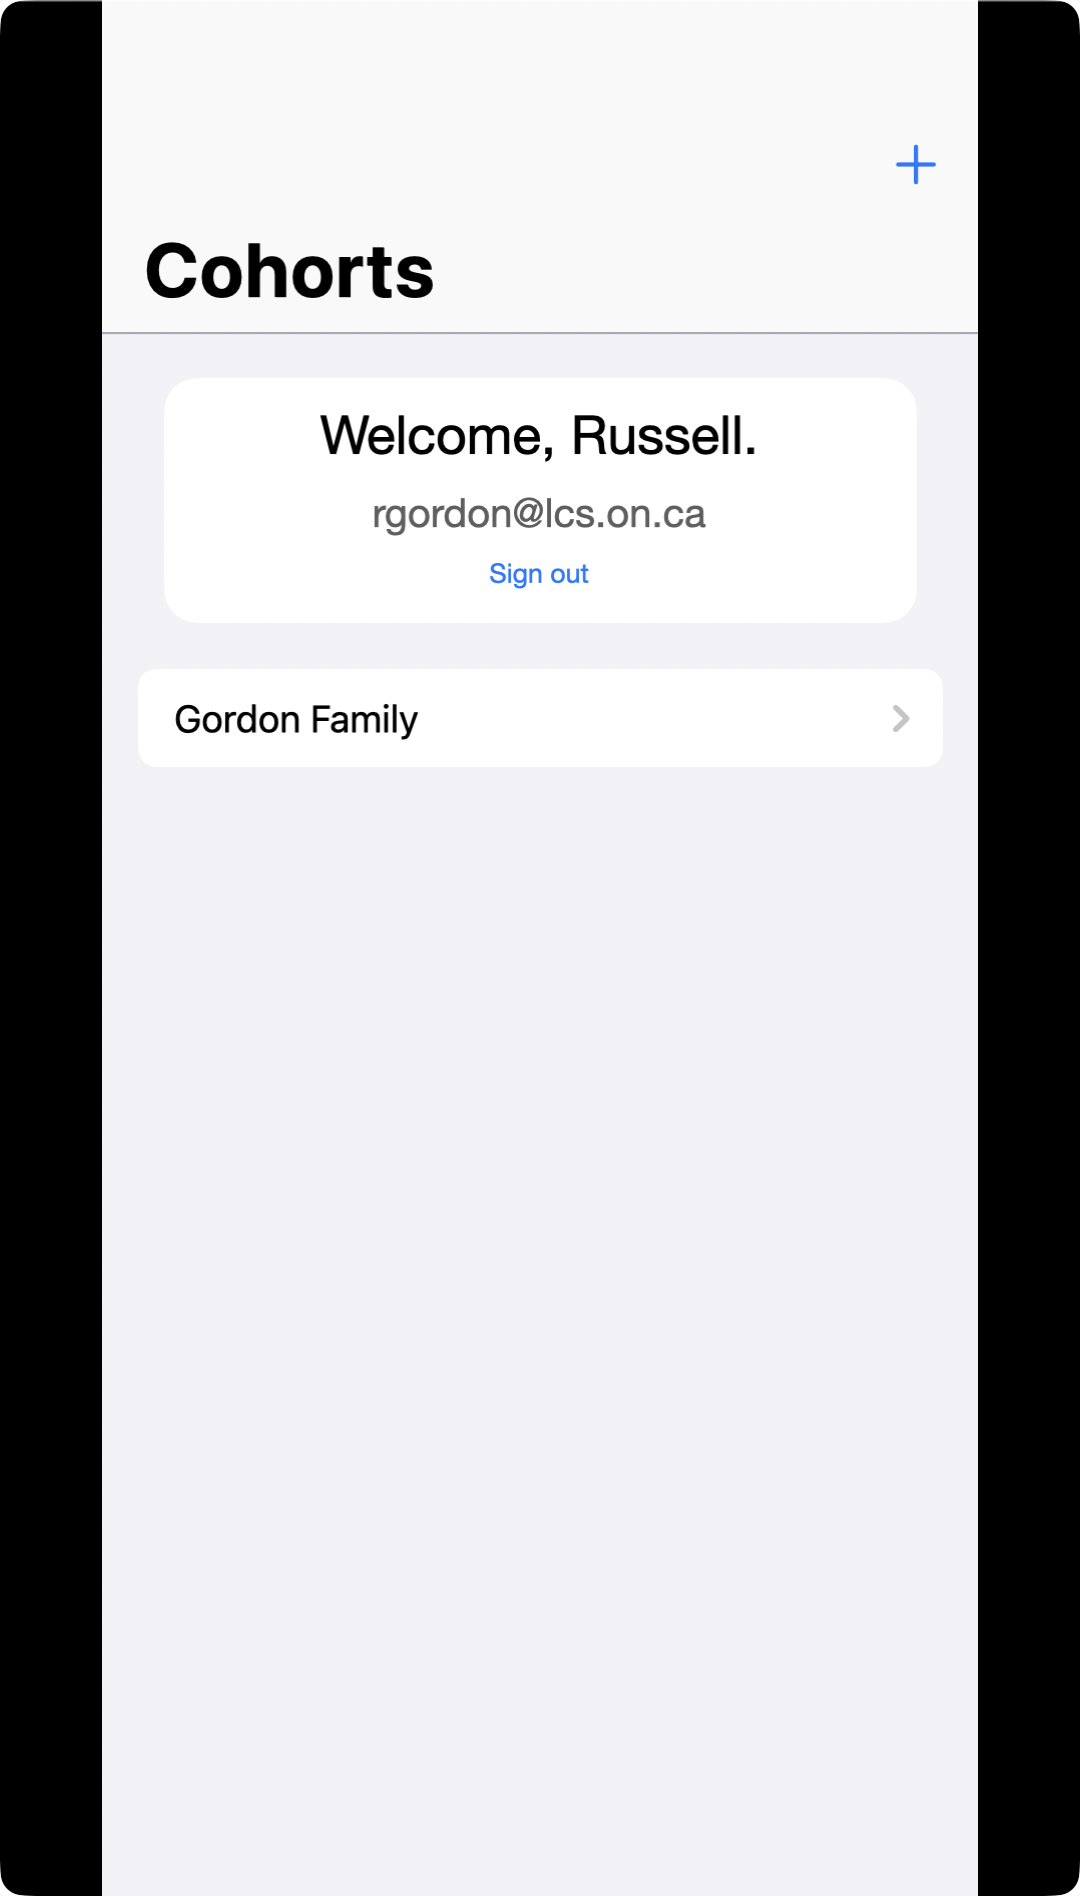
Allow user to create new data
Of course, we don’t just need to read data from a database.
A user of Boné Appetit would need to be able to add a new cohort that they themselves are a member of – while actually using the app.
This is demonstrated within the following screens from the prototype:
Adding a new cohort involves these entities and relationship within the ER diagram:
… and therefore, these tables within the database:
We already know the id of the currently logged in person – we set it (temporarily) earlier on to be always be 1, until we can add user authentication to the app.
If we know the id of the person in question, then to add a new cohort means we must:
- Add a new row to the
cohorttable with the name of the cohort as provided by the user. - Add a new row to the
member_oftable to make the person a member of that new cohort.NOTE
In the new row of the
member_oftable, we would set theadministerscolumn value totrue.Why?
A cohort must have an administrator – since this cohort was just created – for now anyway – that user will be the cohort’s administrator.
Now, we could implement the steps above in two different ways:
- From our application, add the row the
cohorttable – then get the unique identifier for that new row – and then add the row to themember_oftable. - From our application, invoke a database function to add the necessary rows to the
cohorttable and themember_oftable in one fell swoop – using something called a transaction – which guarantees that both required rows will be created – or none.
The second option is the way to go. Using the first option means there are two separate calls made across the Internet to the database. The second option requires just one call to the database, and the request is guaranteed to either fully complete, or fail. That second option is preferable.
NOTE
It would involve a complete course to learn every aspect of SQL syntax required to fully administer a database. This is a good opportunity to use the built-in AI agent that is part of the Supabase product to write the database function for us.
We can navigate to the SQL Editor interface and create a new snippet:
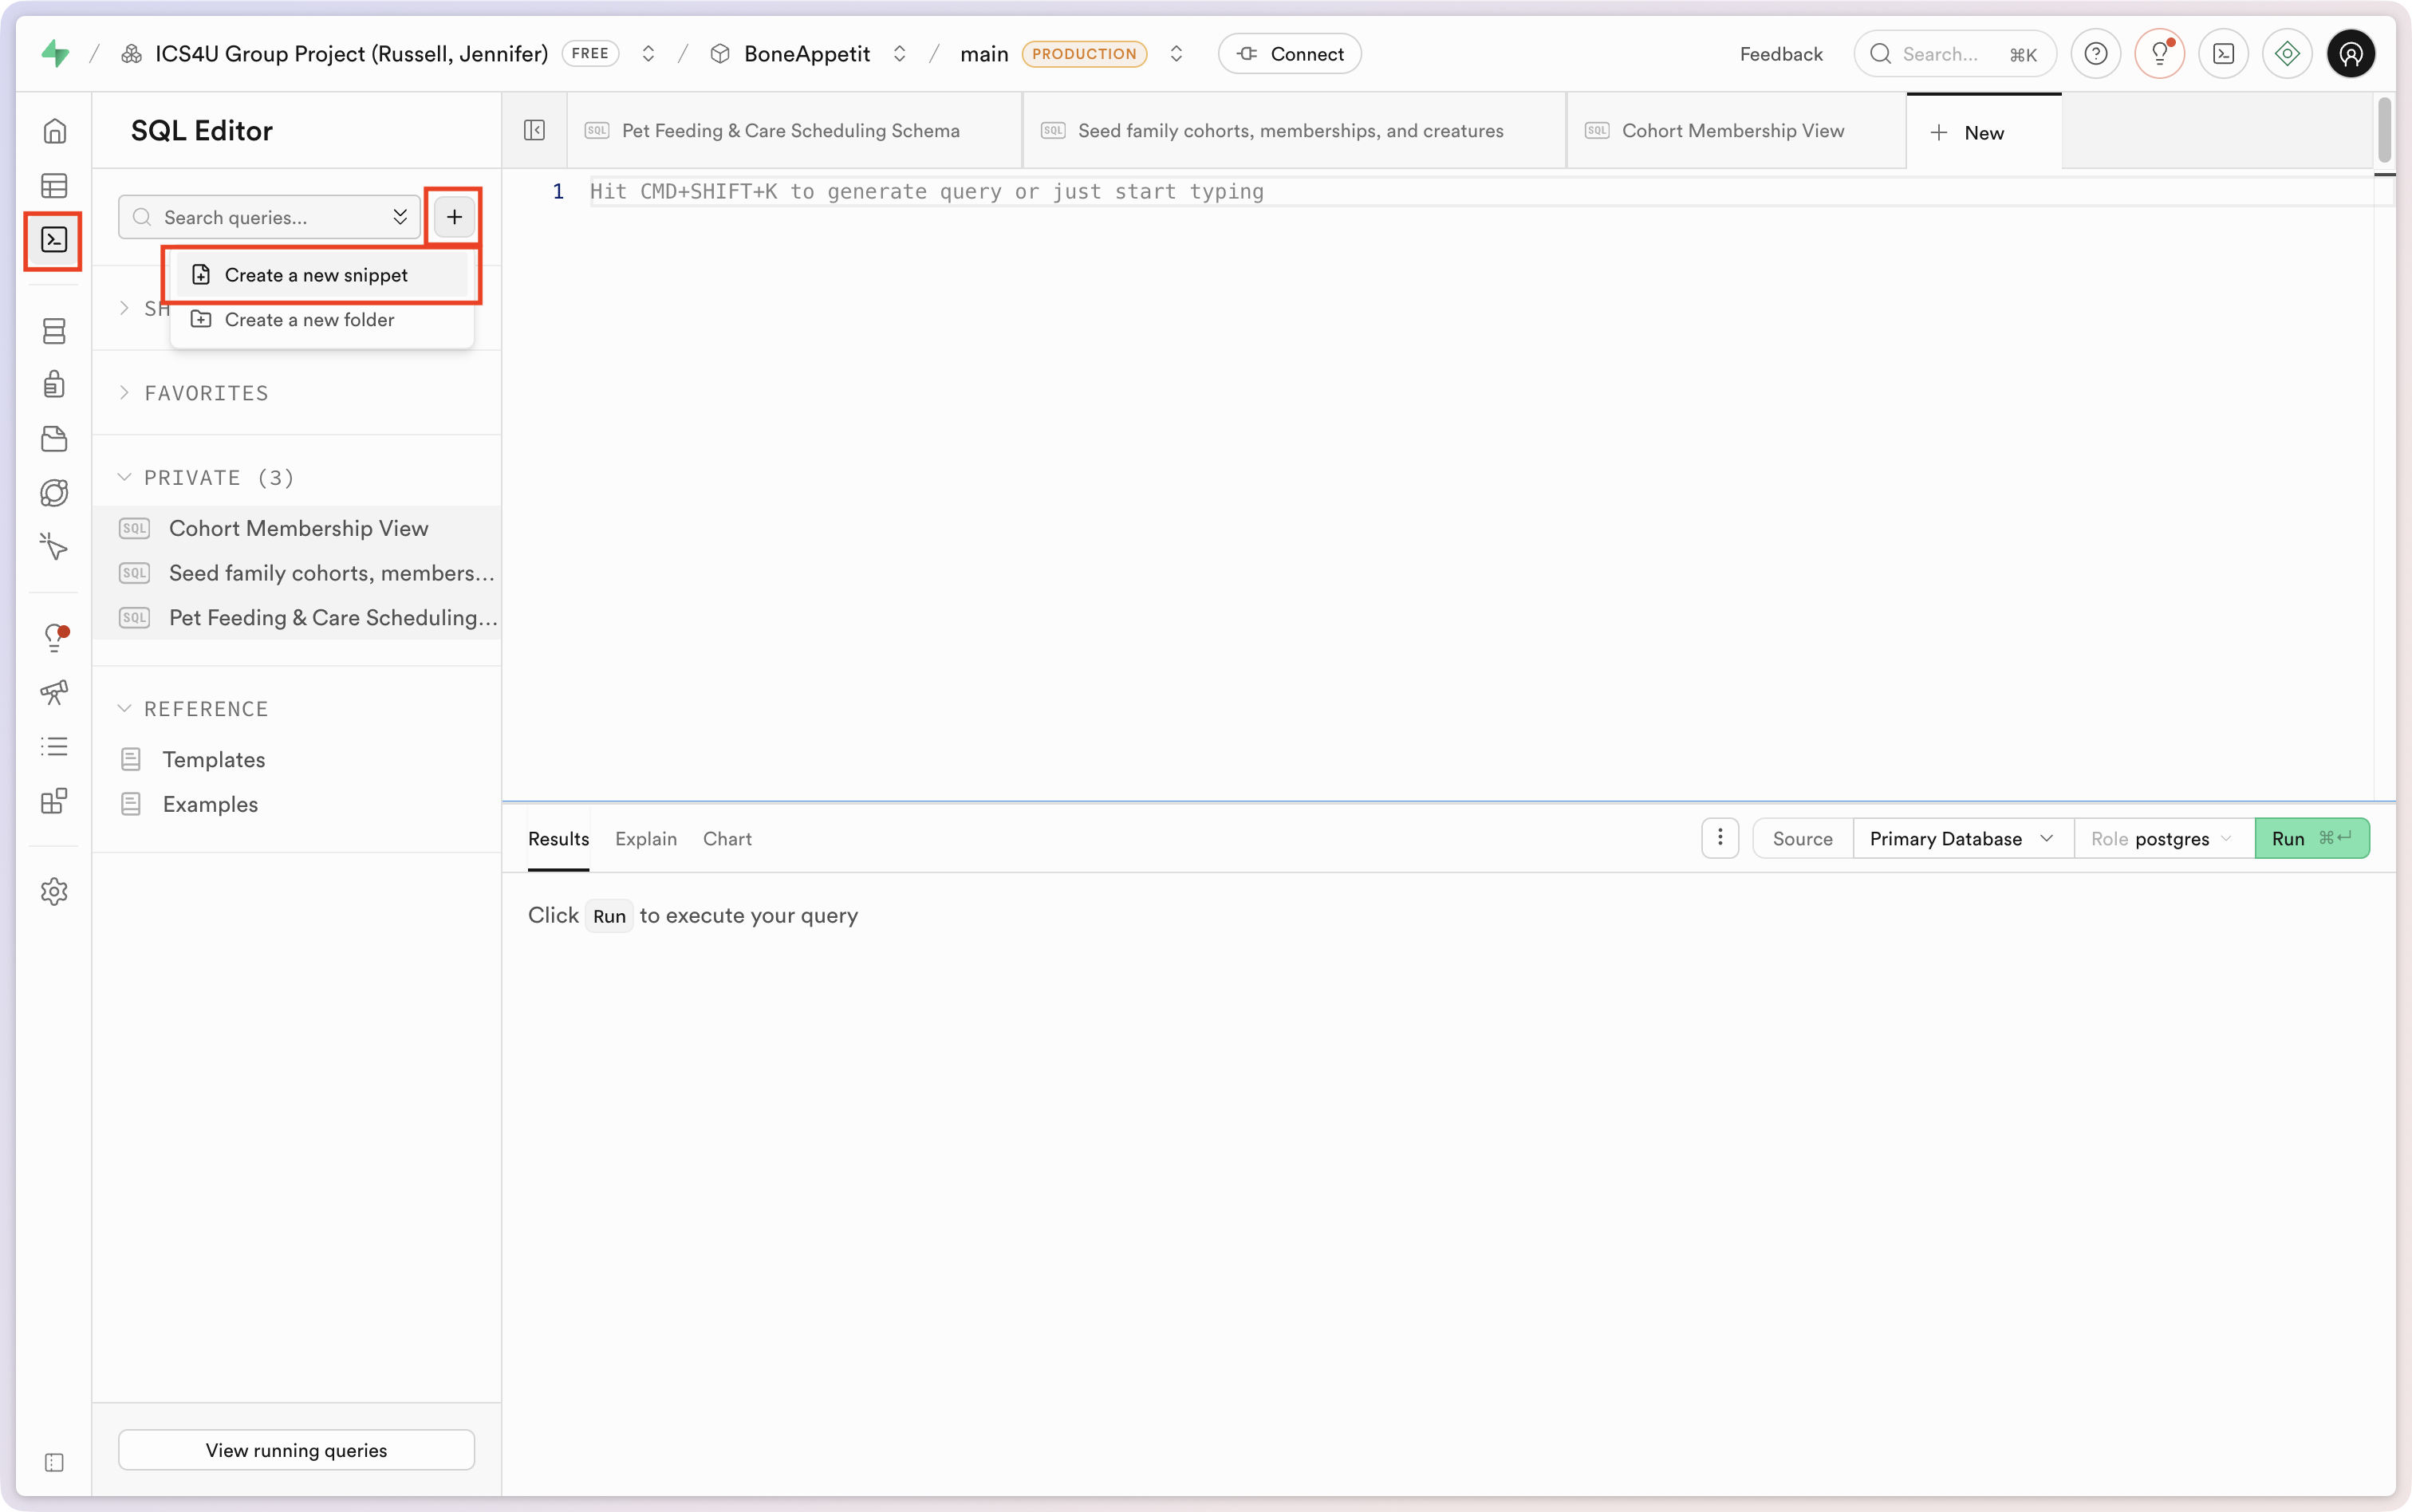
Then invoke the AI agent using Command-I or by clicking this button:
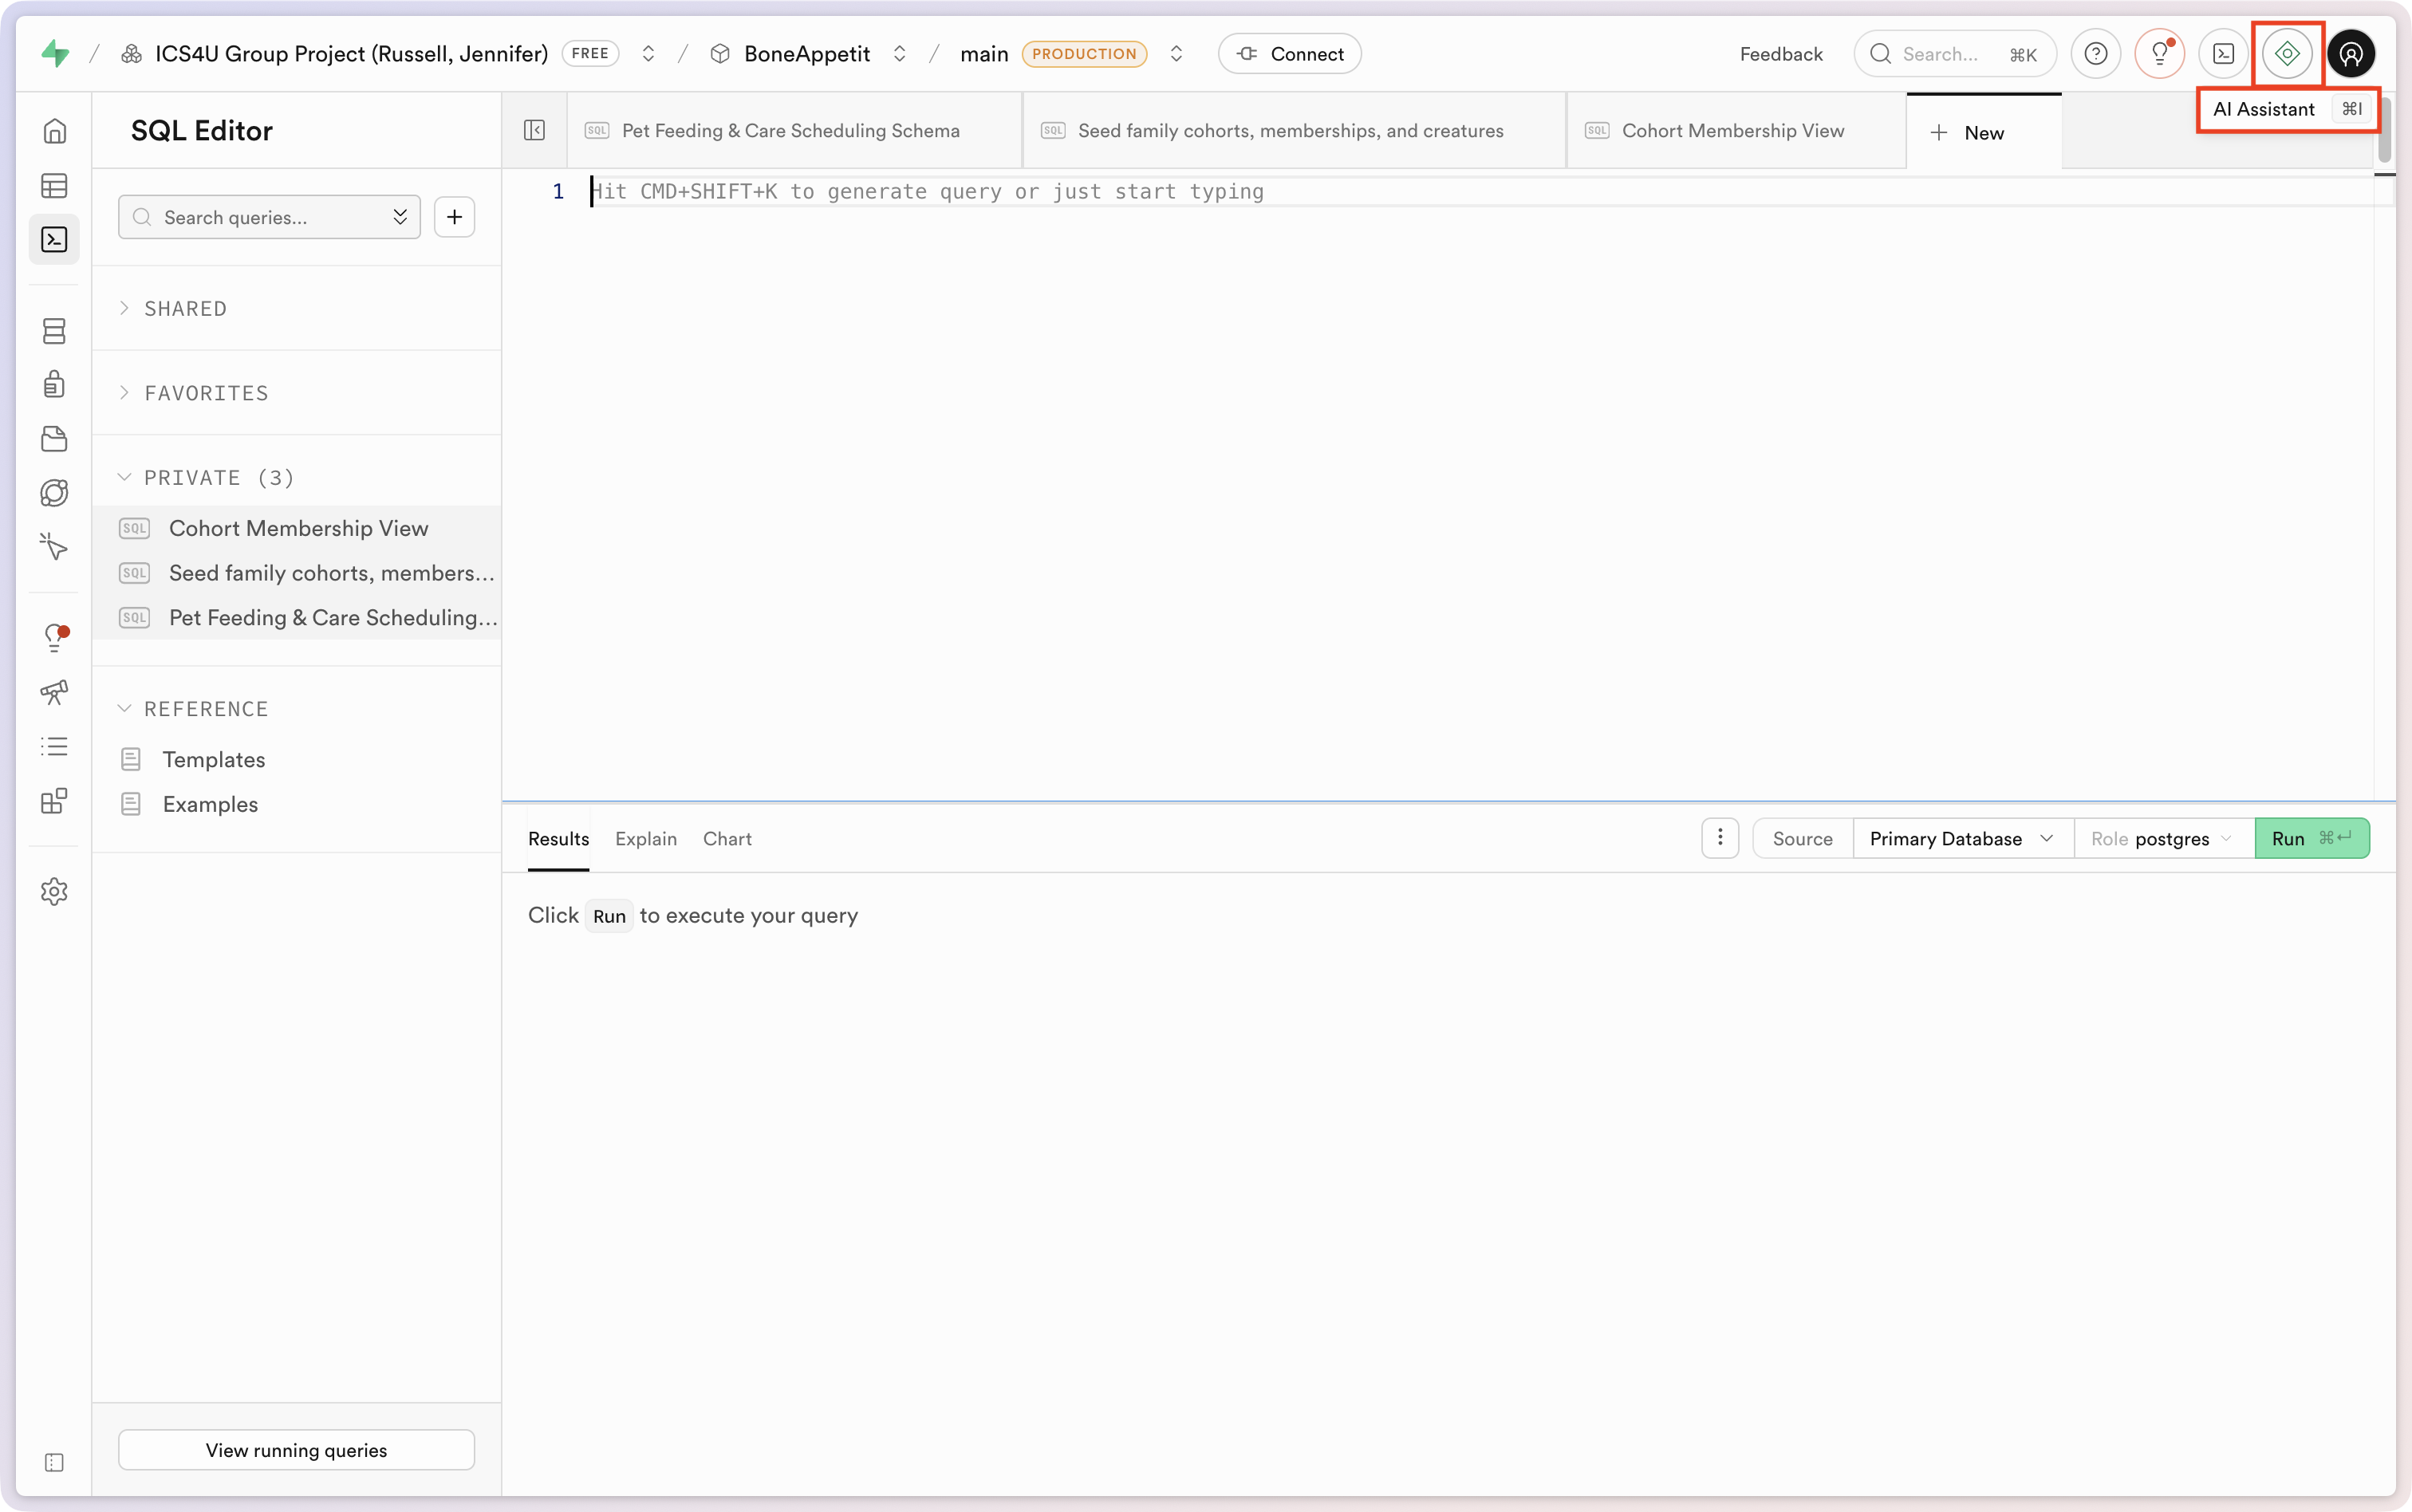
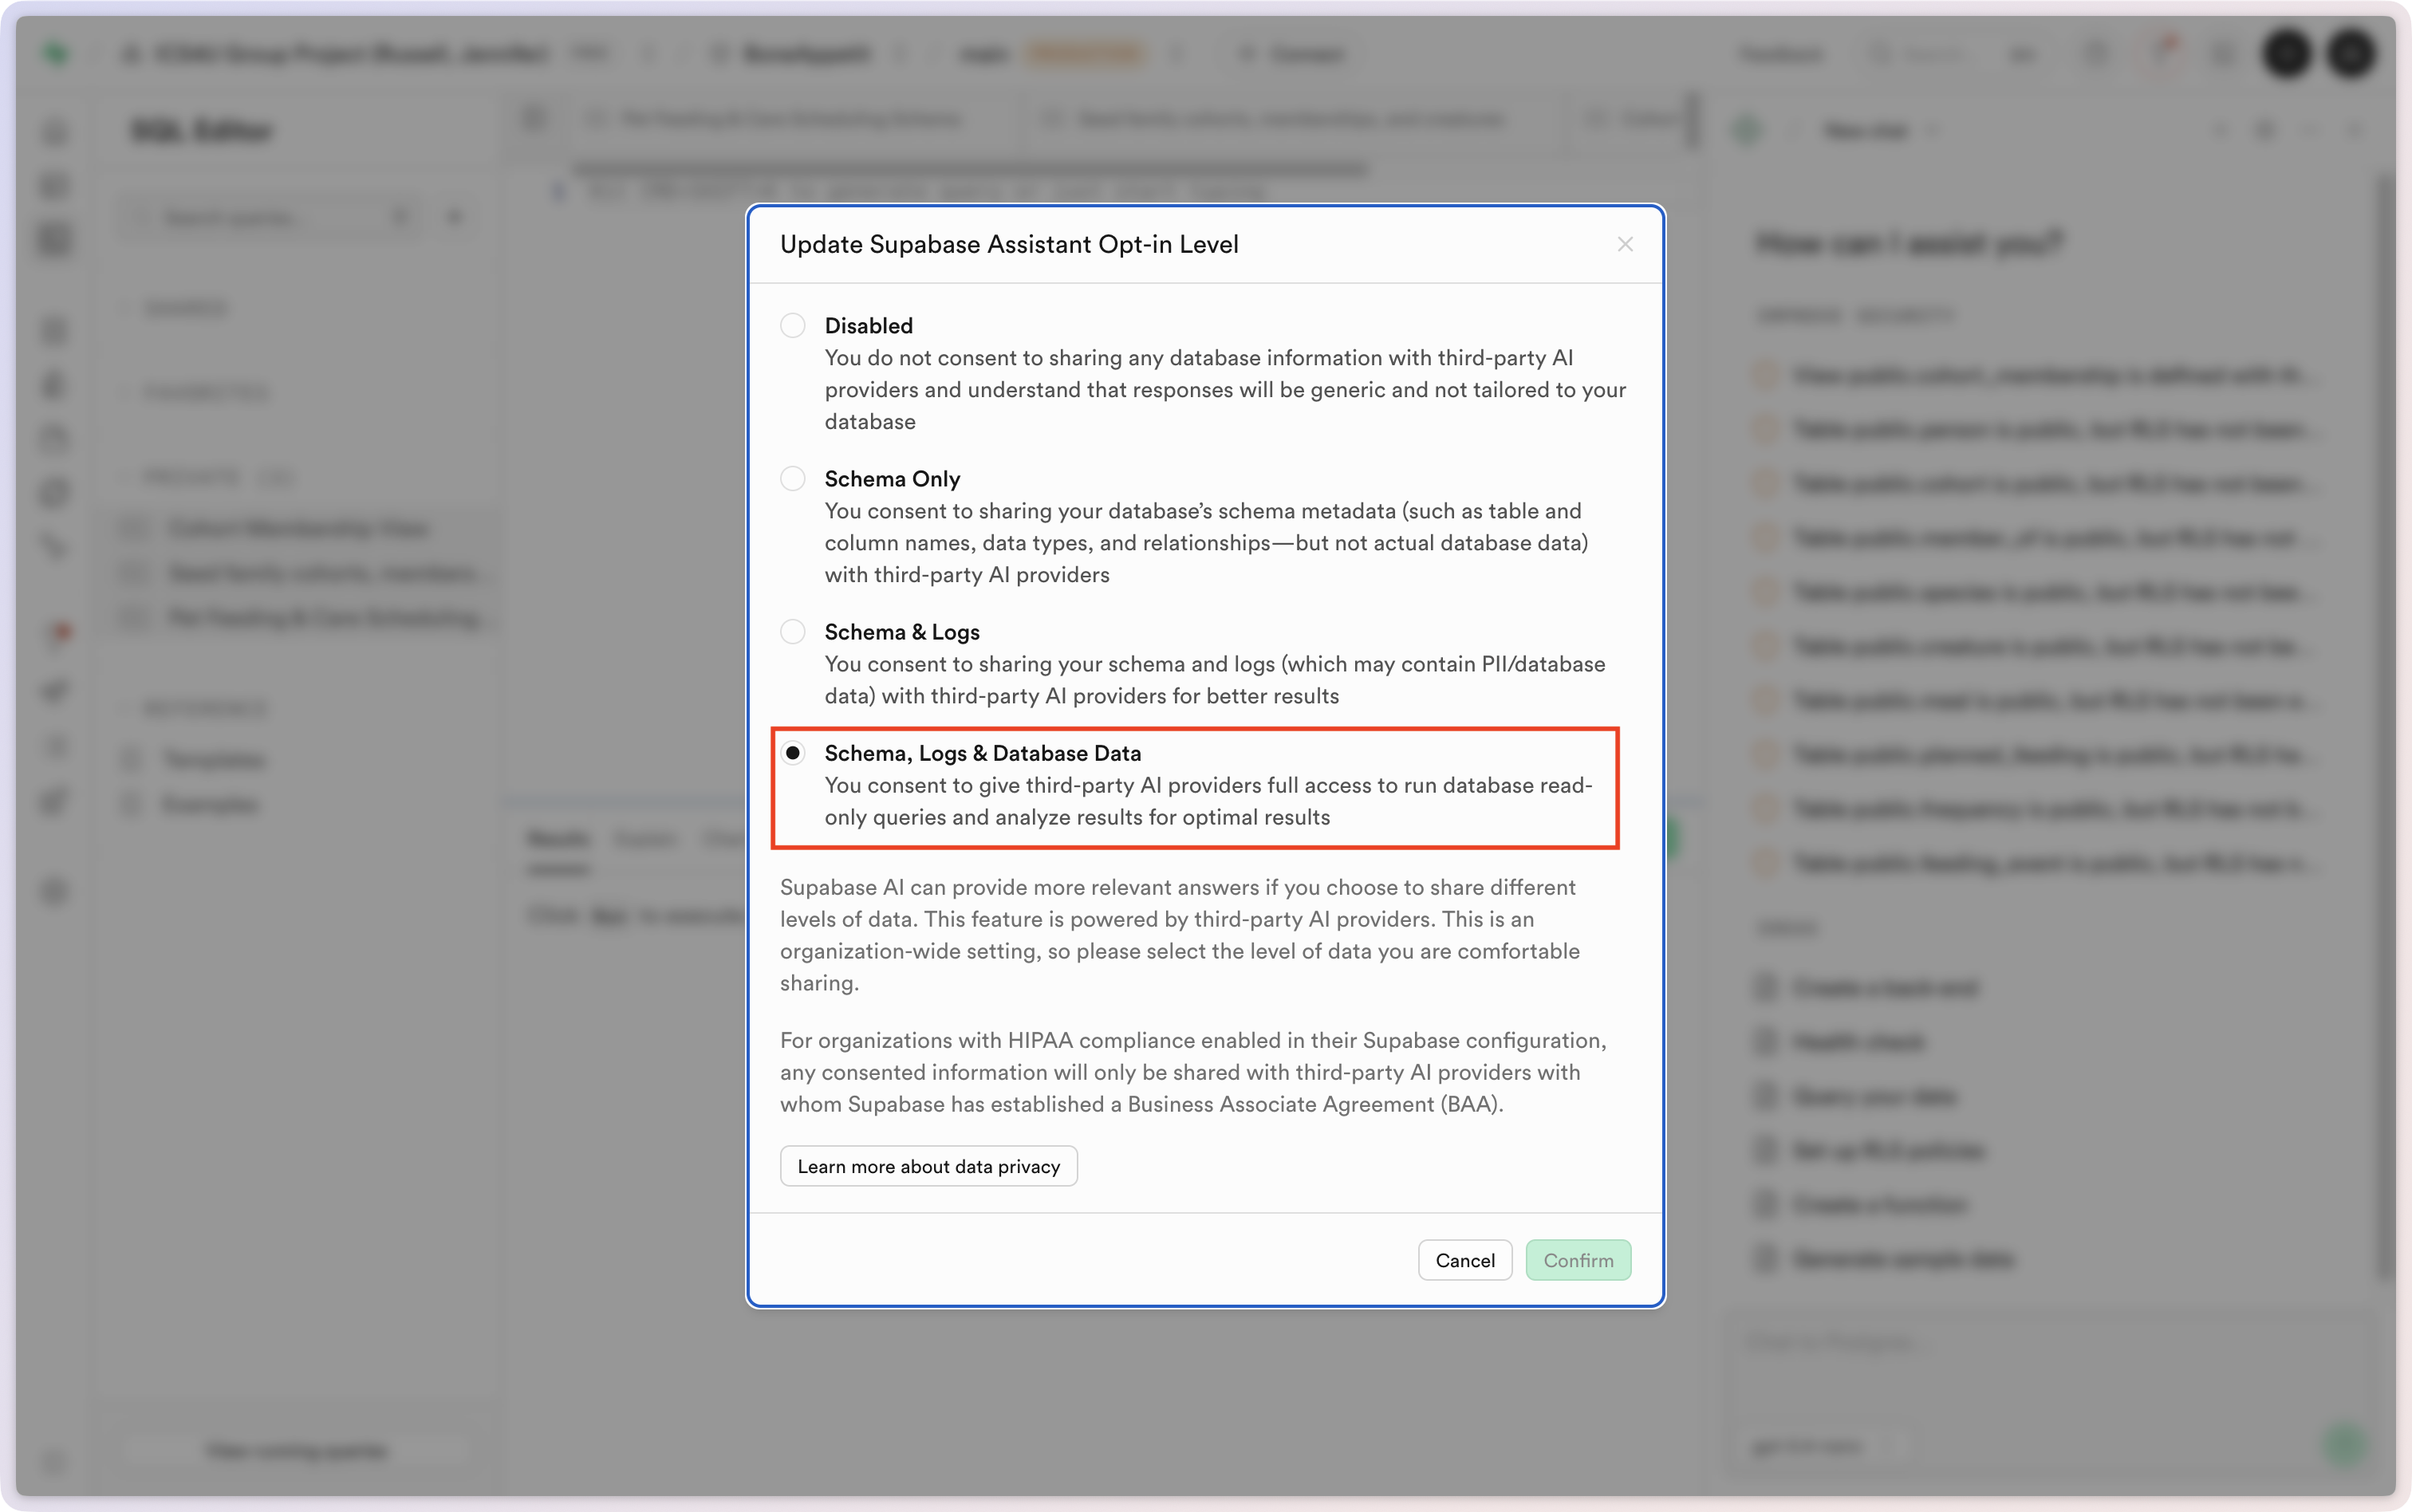
Before you start, be sure to grant the AI agent access to your full database:
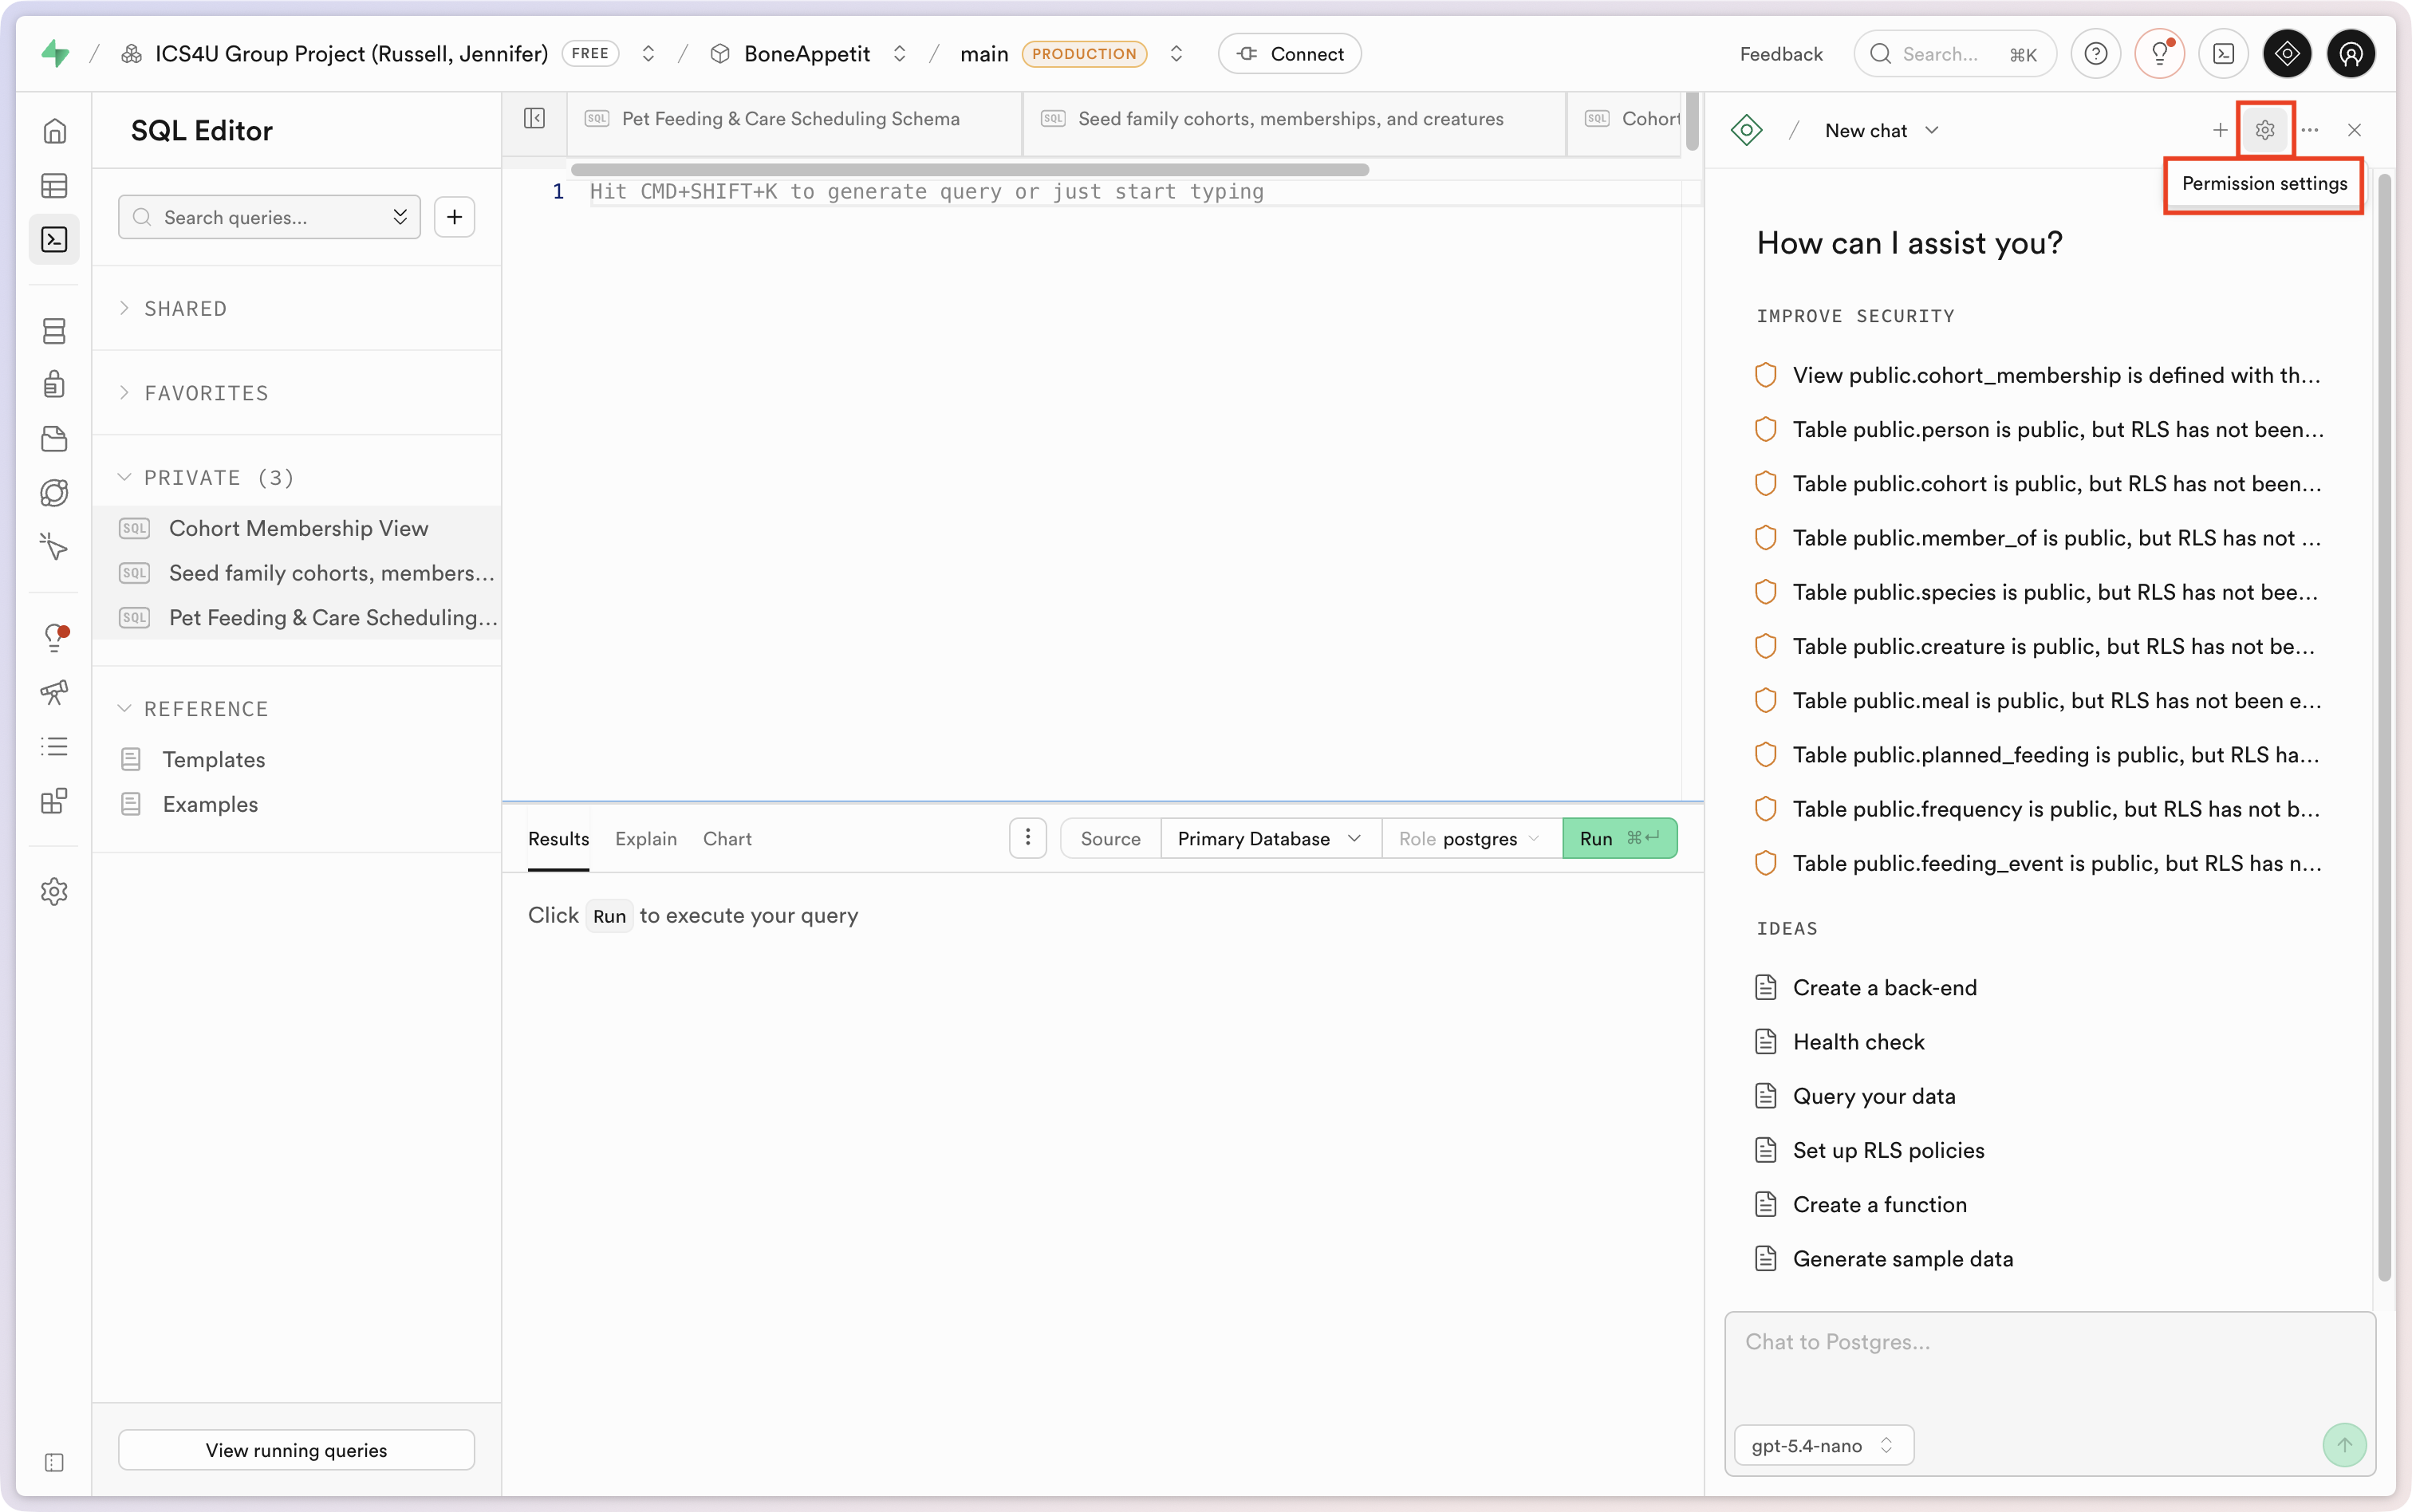
Use this options, then press the green Confirm button:
Here is a query we can use to create the database function”:
Please write a database function that accepts a
person_idargument of typeint8and acohort_nameargument of typetext.The function should carry out its operations as a transaction – so that the table insertions either fully complete, or do not complete at all.
The function should first add a row to the
cohorttable using thecohort_nameargument.The resulting unique identifier for the newly created cohort should be used to create a corresponding row in the
member_oftable that links the person identified byperson_idto the new cohort.date_invitedshould be set to the current date and time.is_membership_acceptedshould be set totrue.is_membership_pausedshould be set tofalse.administersshould be set totrue.
Here is the SQL produced by the Supabase AI agent:
CREATE OR REPLACE FUNCTION public.create_cohort_and_membership(
  p_person_id   int8,
  p_cohort_name text
)
RETURNS TABLE (
  cohort_id  int8,
  member_id  int8
)
LANGUAGE plpgsql
AS $$
DECLARE
  v_cohort_id int8;
  v_member_id int8;
BEGIN
  -- In Postgres, all statements inside a function execute atomically:
  -- if any statement errors, the whole call is rolled back.
  INSERT INTO public.cohort (name)
  VALUES (p_cohort_name)
  RETURNING id INTO v_cohort_id;

  INSERT INTO public.member_of (
    person_id,
    cohort_id,
    date_invited,
    is_membership_accepted,
    is_membership_paused,
    administers
  )
  VALUES (
    p_person_id,
    v_cohort_id,
    now(),
    true,
    false,
    true
  )
  RETURNING id INTO v_member_id;

  RETURN QUERY
  SELECT v_cohort_id, v_member_id;
END;
$$;
Running that query in the SQL editor creates the function.
We can test the function directly in the database using this SQL:
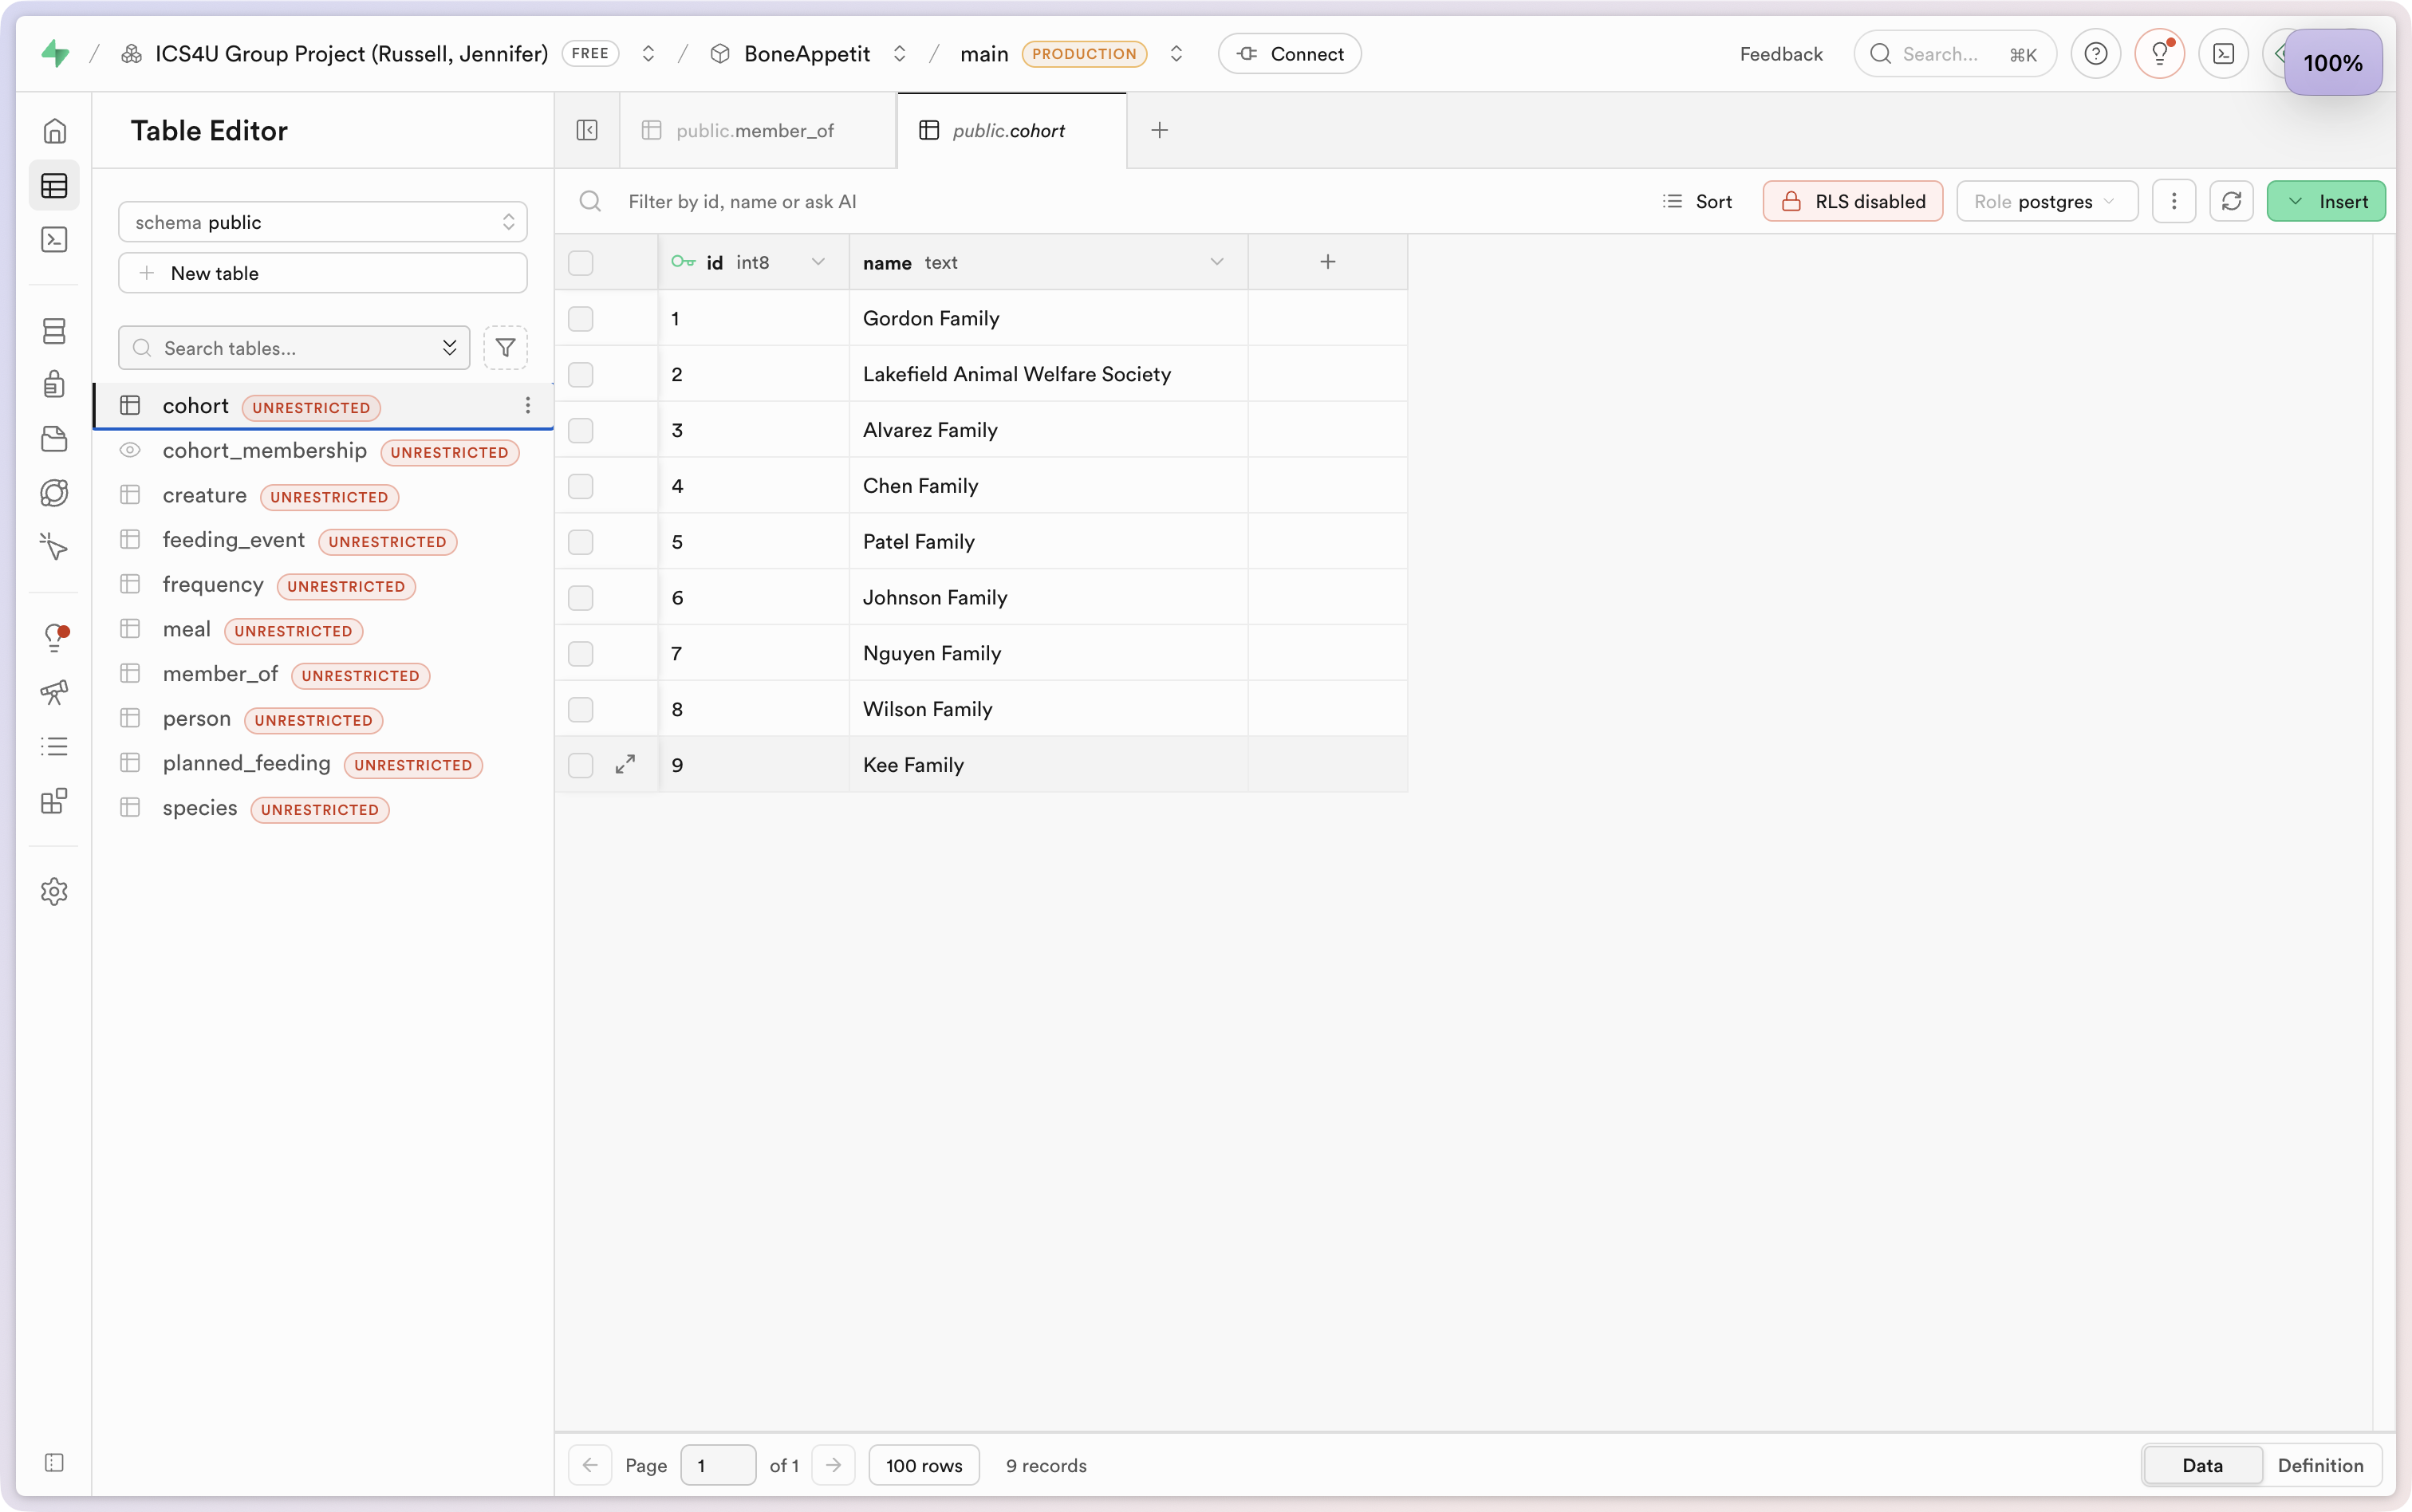
SELECT * FROM public.create_cohort_and_membership(1, 'Kee Family');If we run this query that in turn runs the newly created function, these are the immediate results:
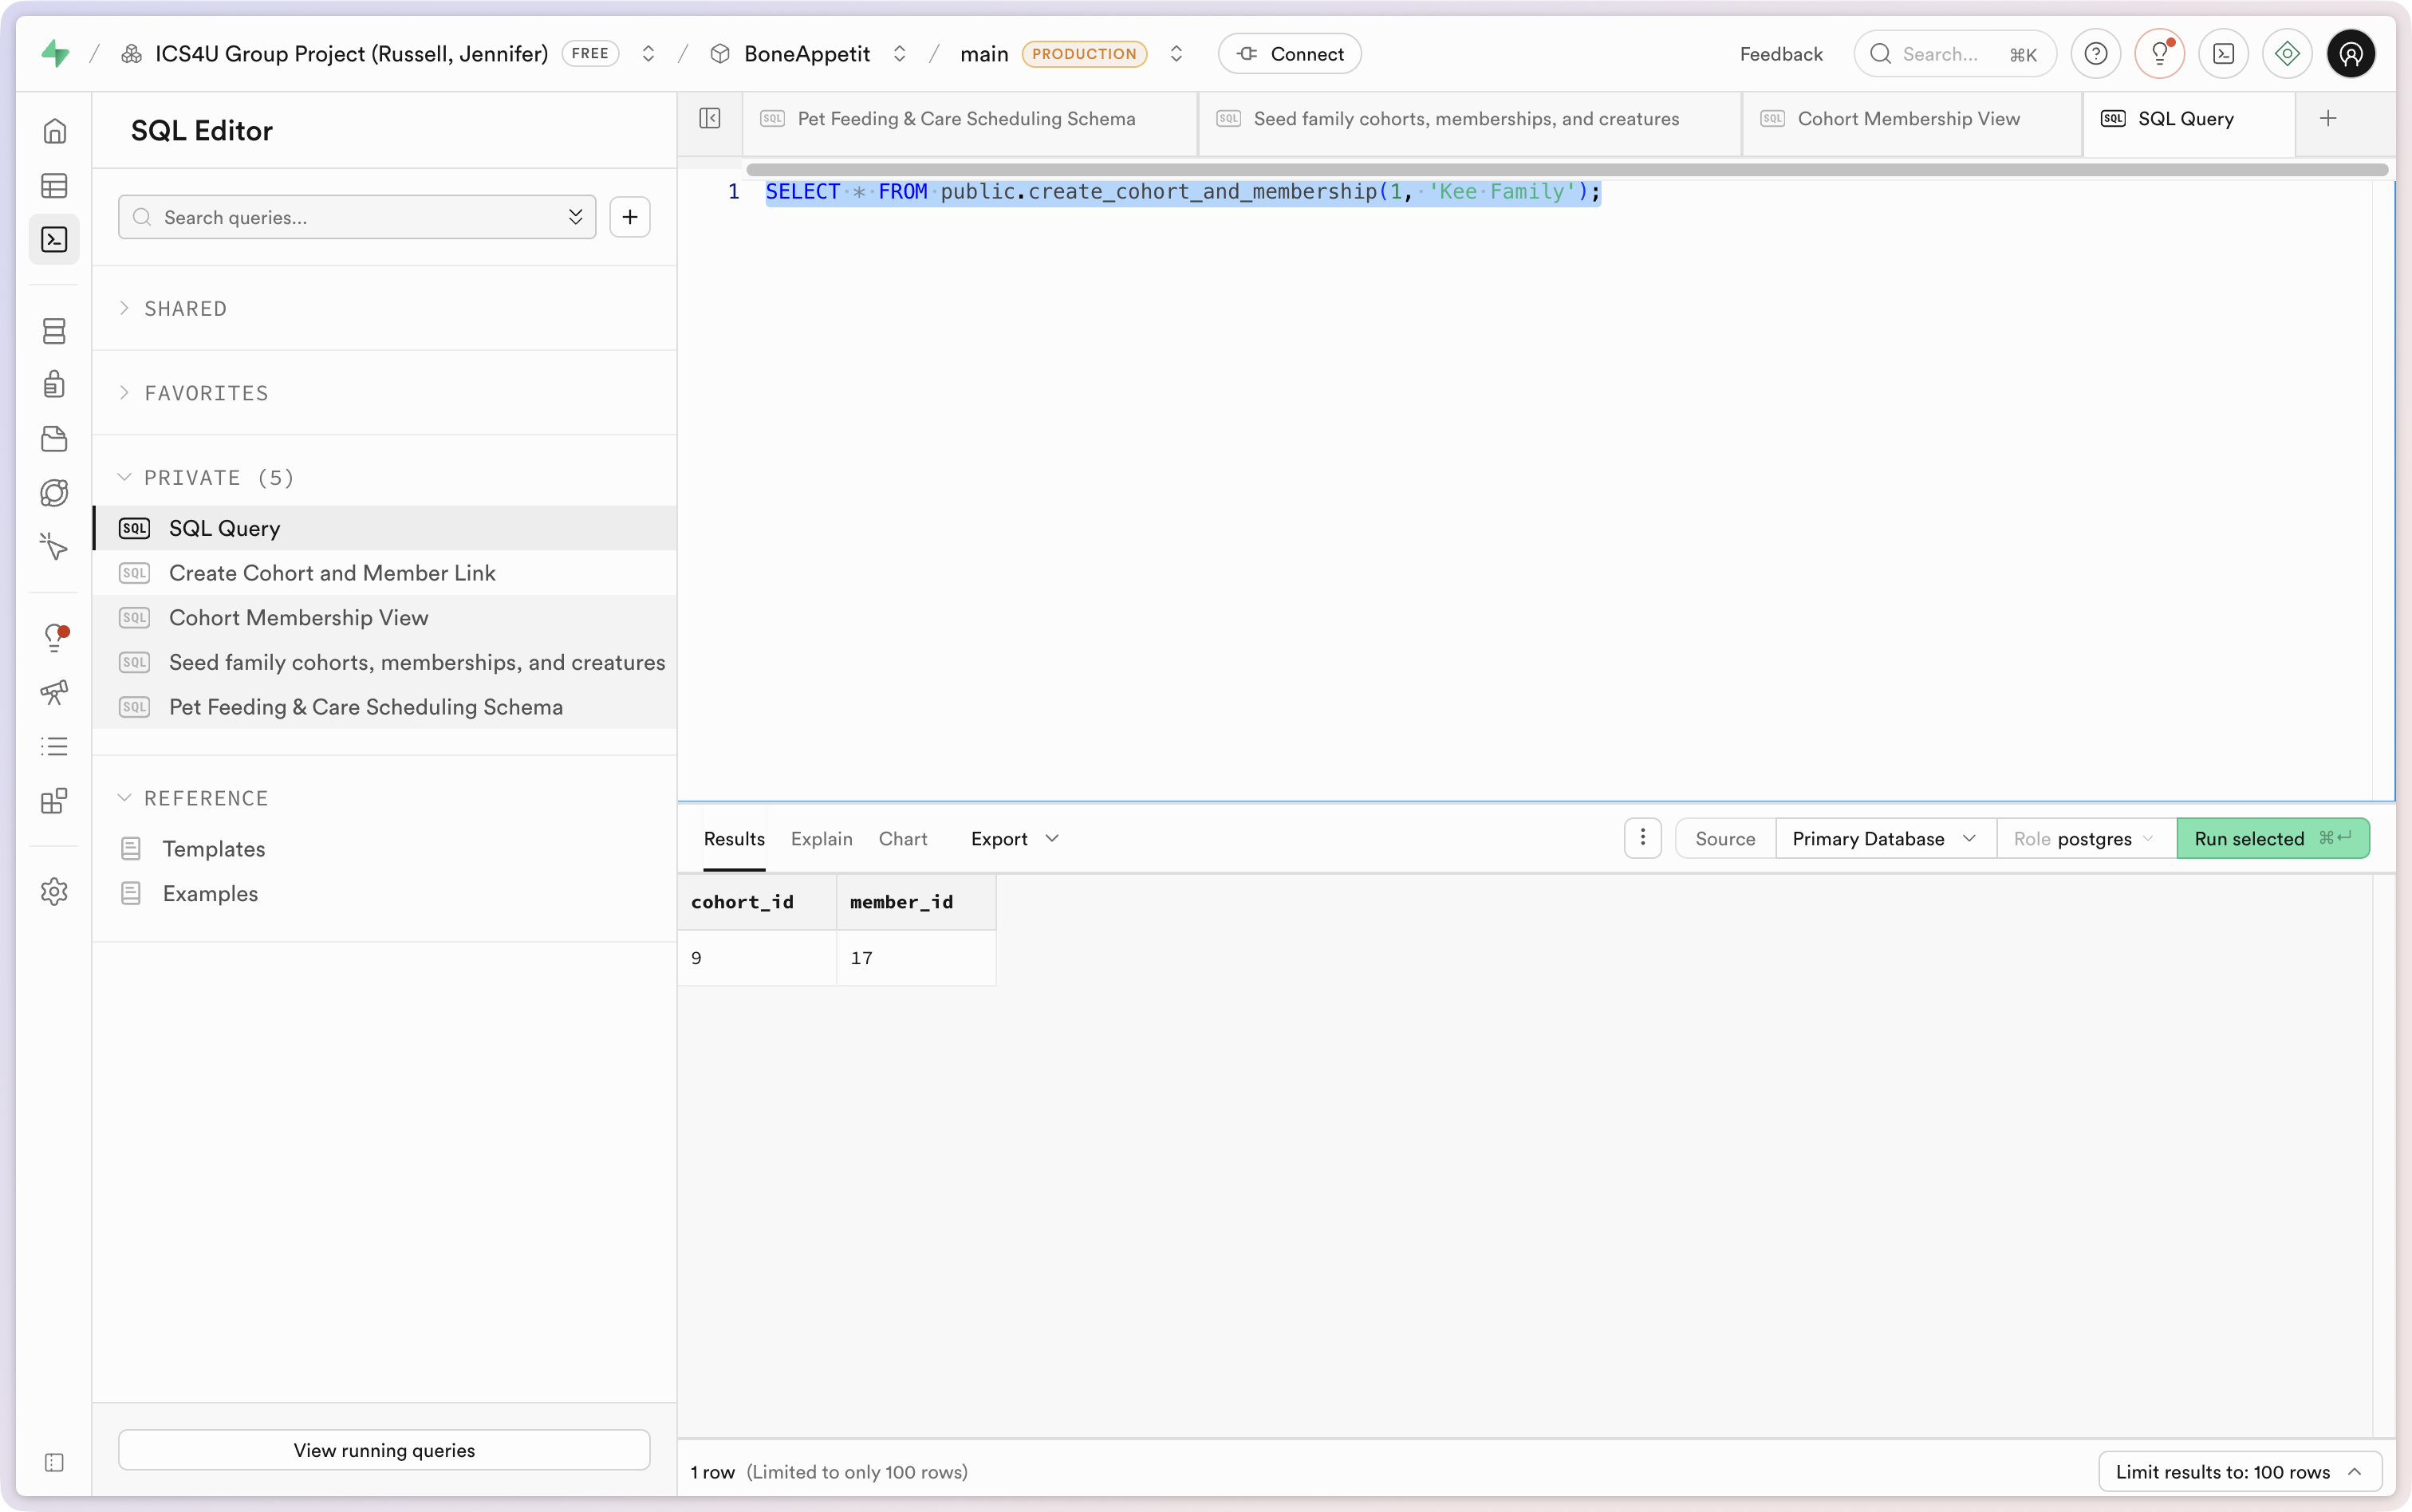
We can see the new row of data in the cohort table:
… and in the member_of table:
So, now we just need to:
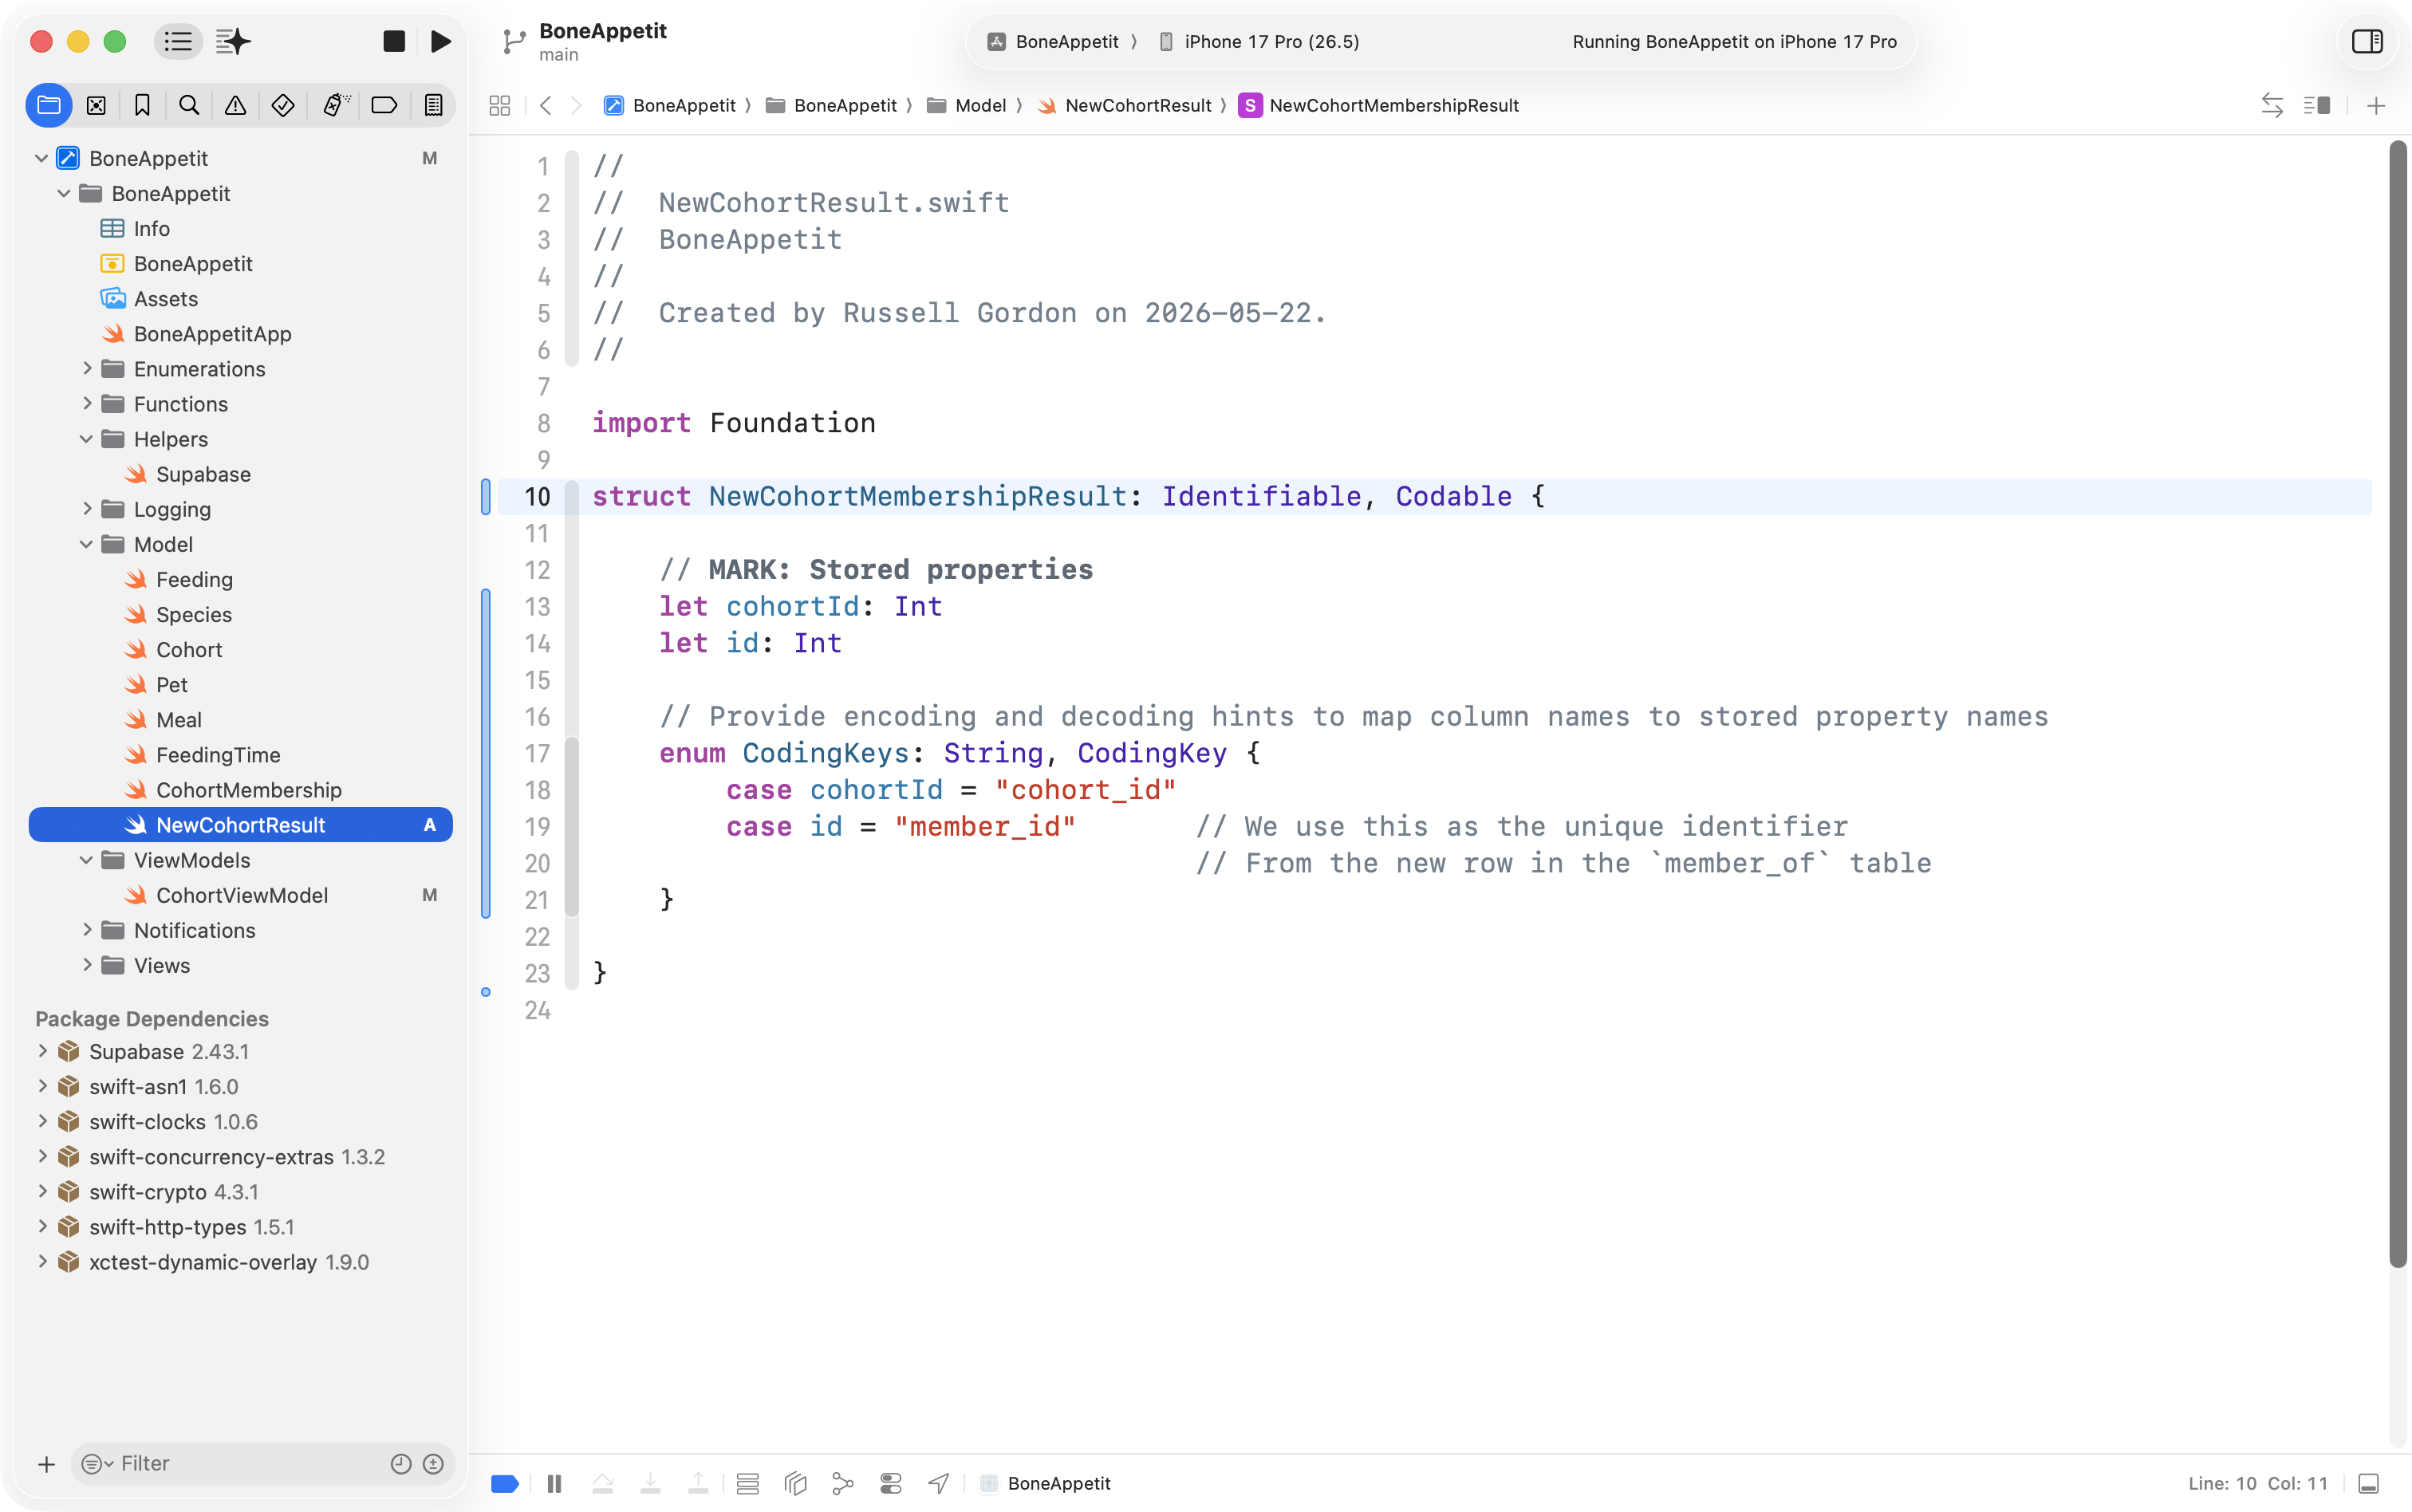
- Add a small file to the model layer to receive the results of running the database function.
- Invoke the database function from a view model within our app.
- Modify the view within our app that allows the user to create a new cohort within a local array to instead create the new cohort using the view model.
Here is the file added to the model layer:
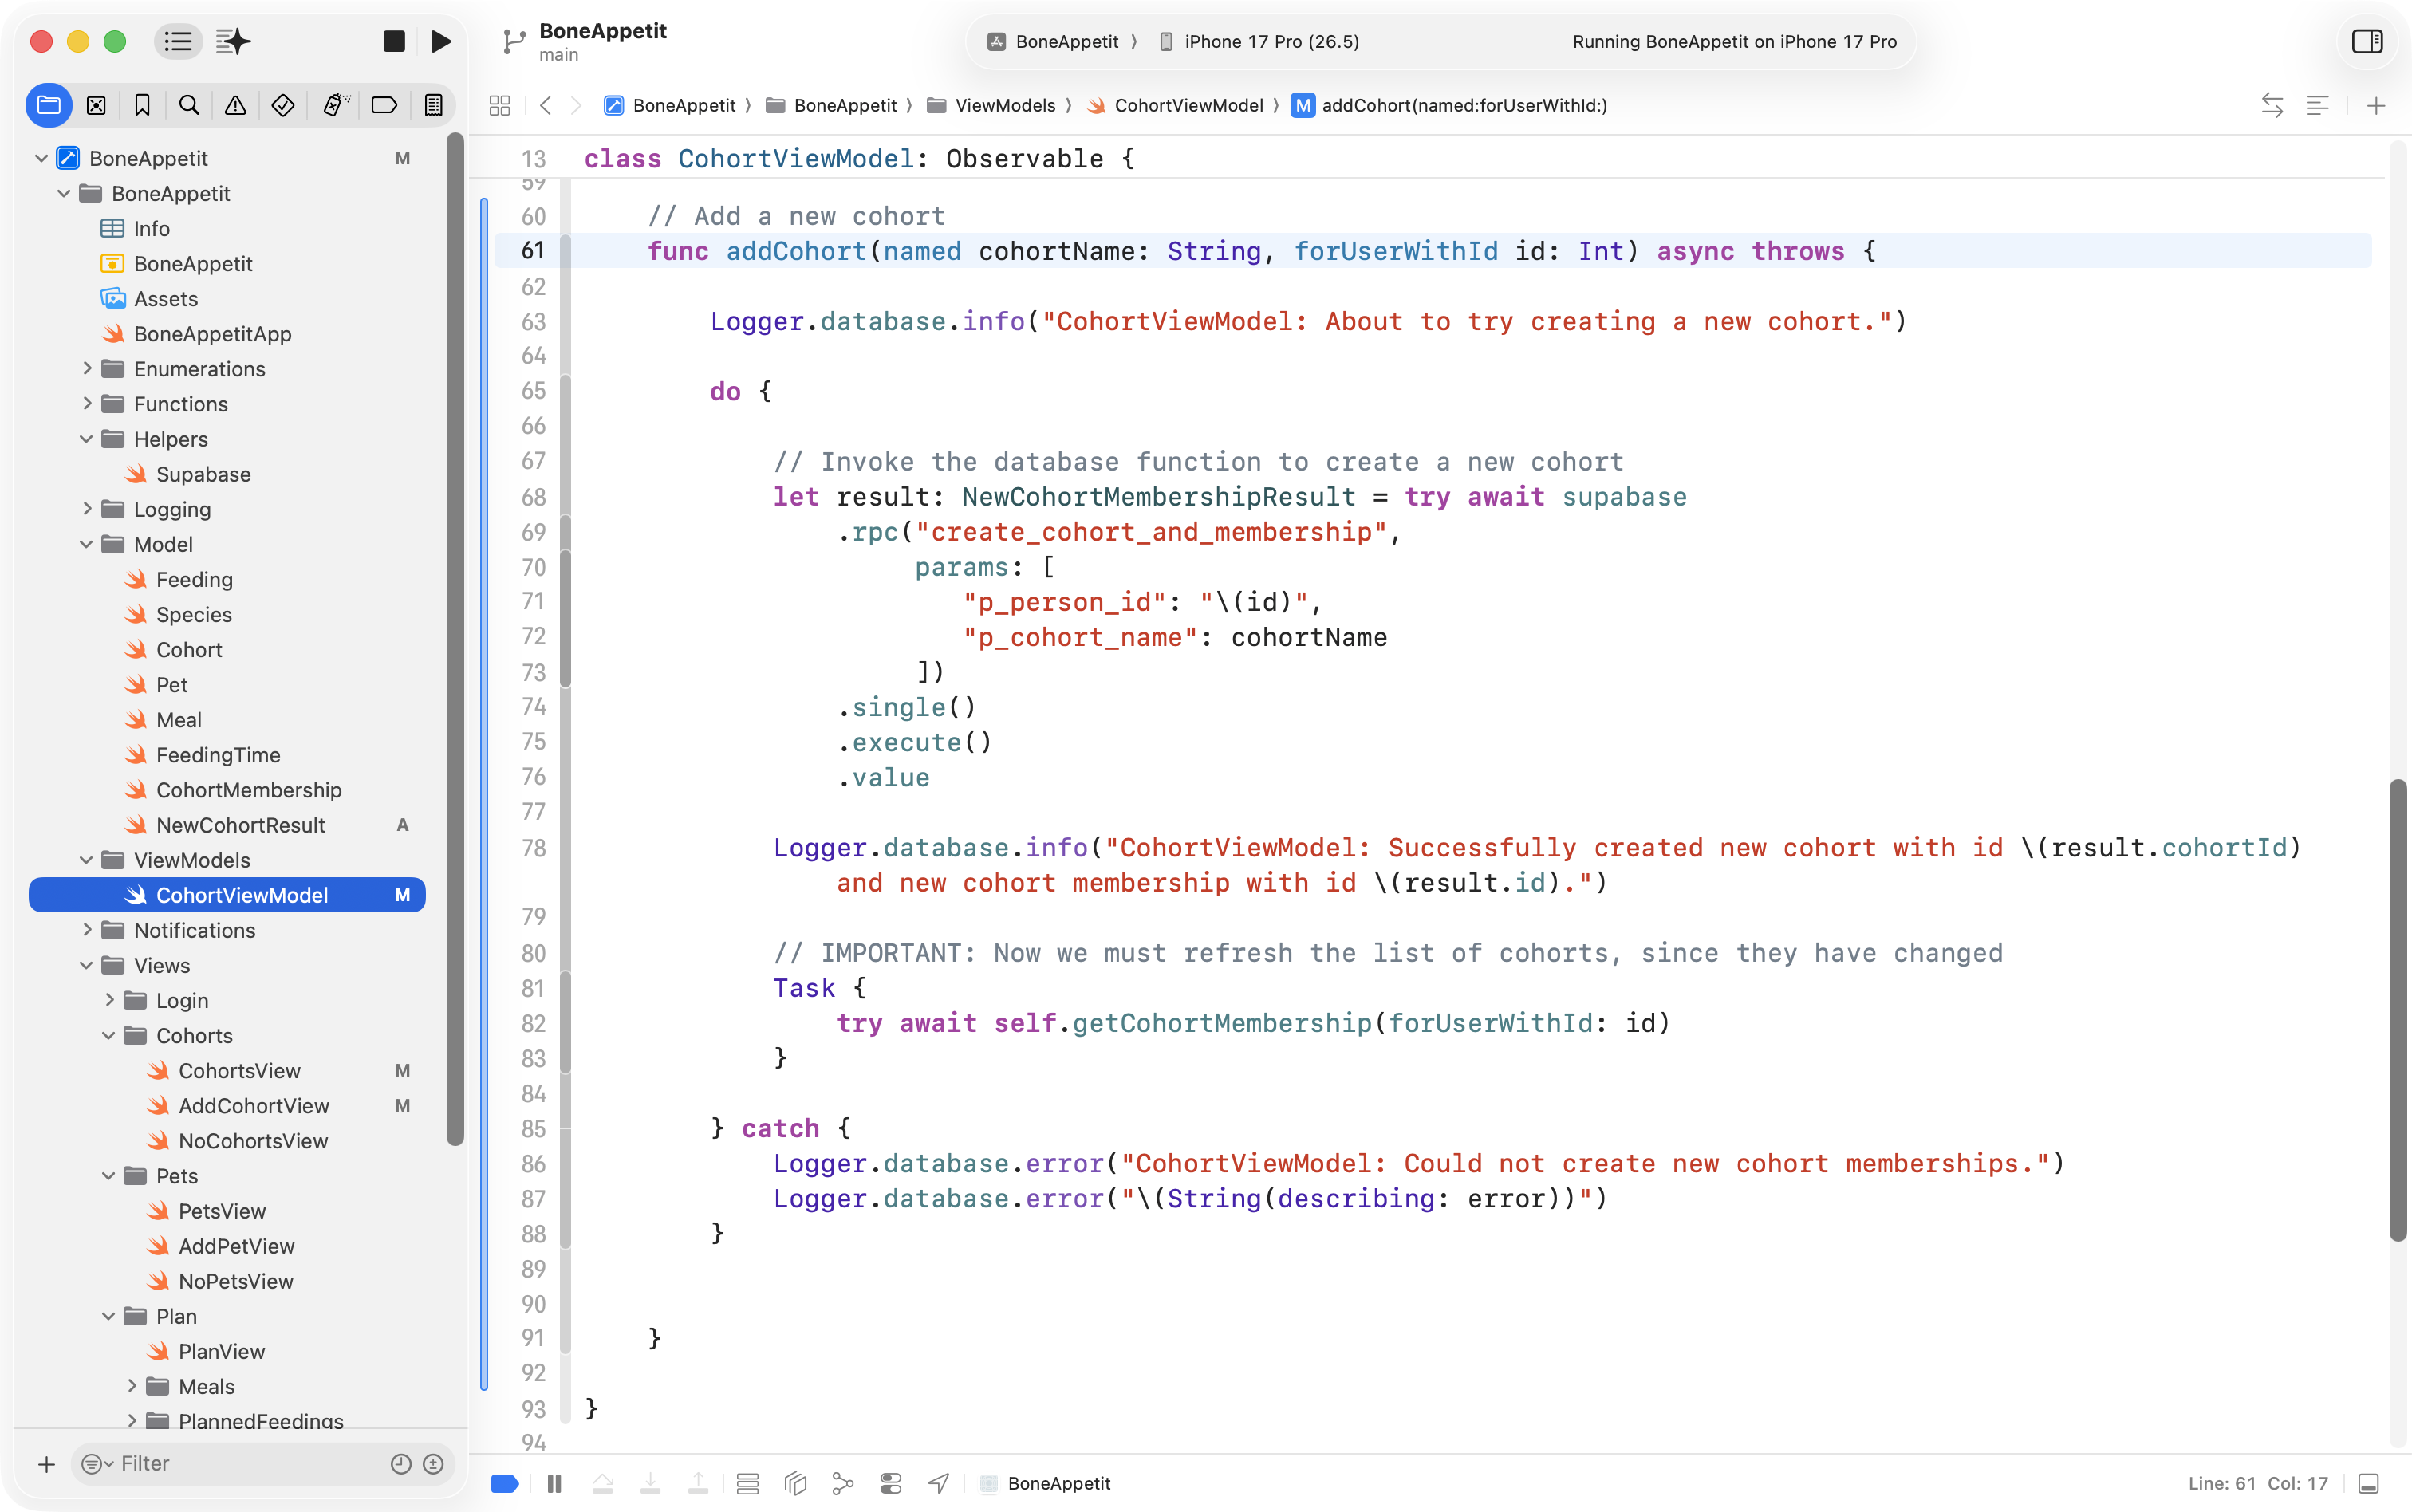
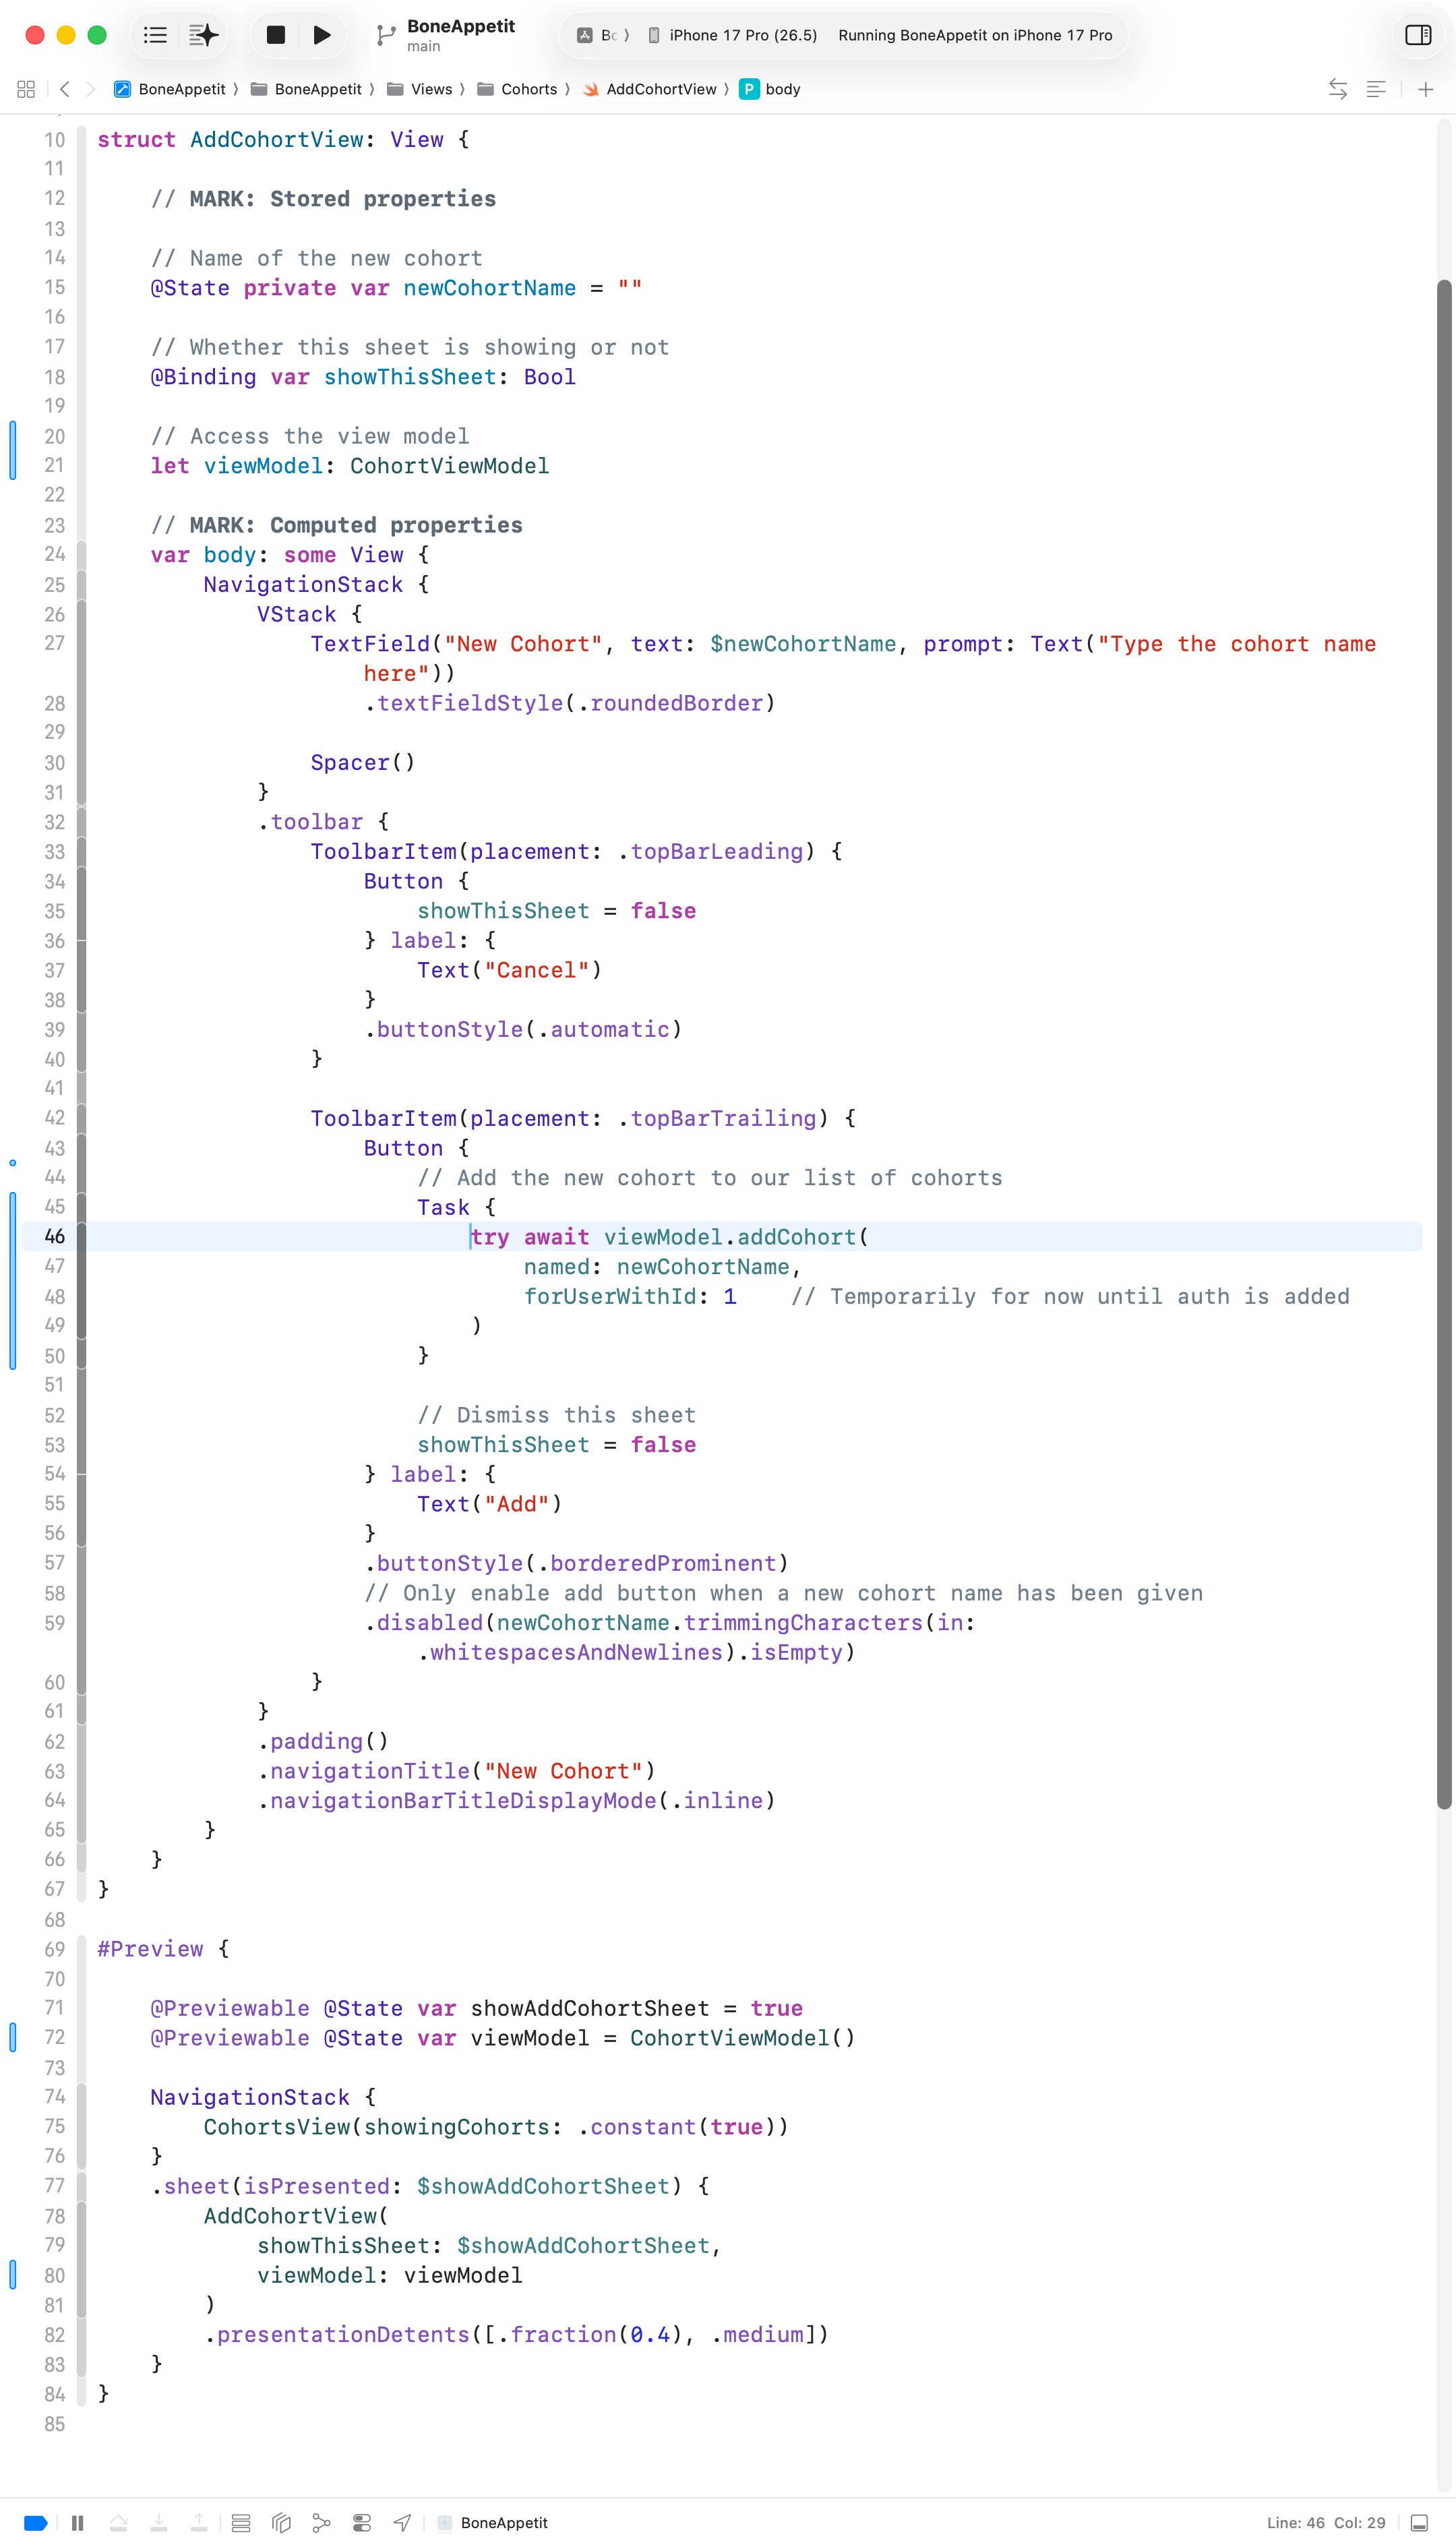
Here is the file added to the view model:
Here are the changes to the existing views – look for the blue bars at left to see where code changed – this is the view that shows the sheet:
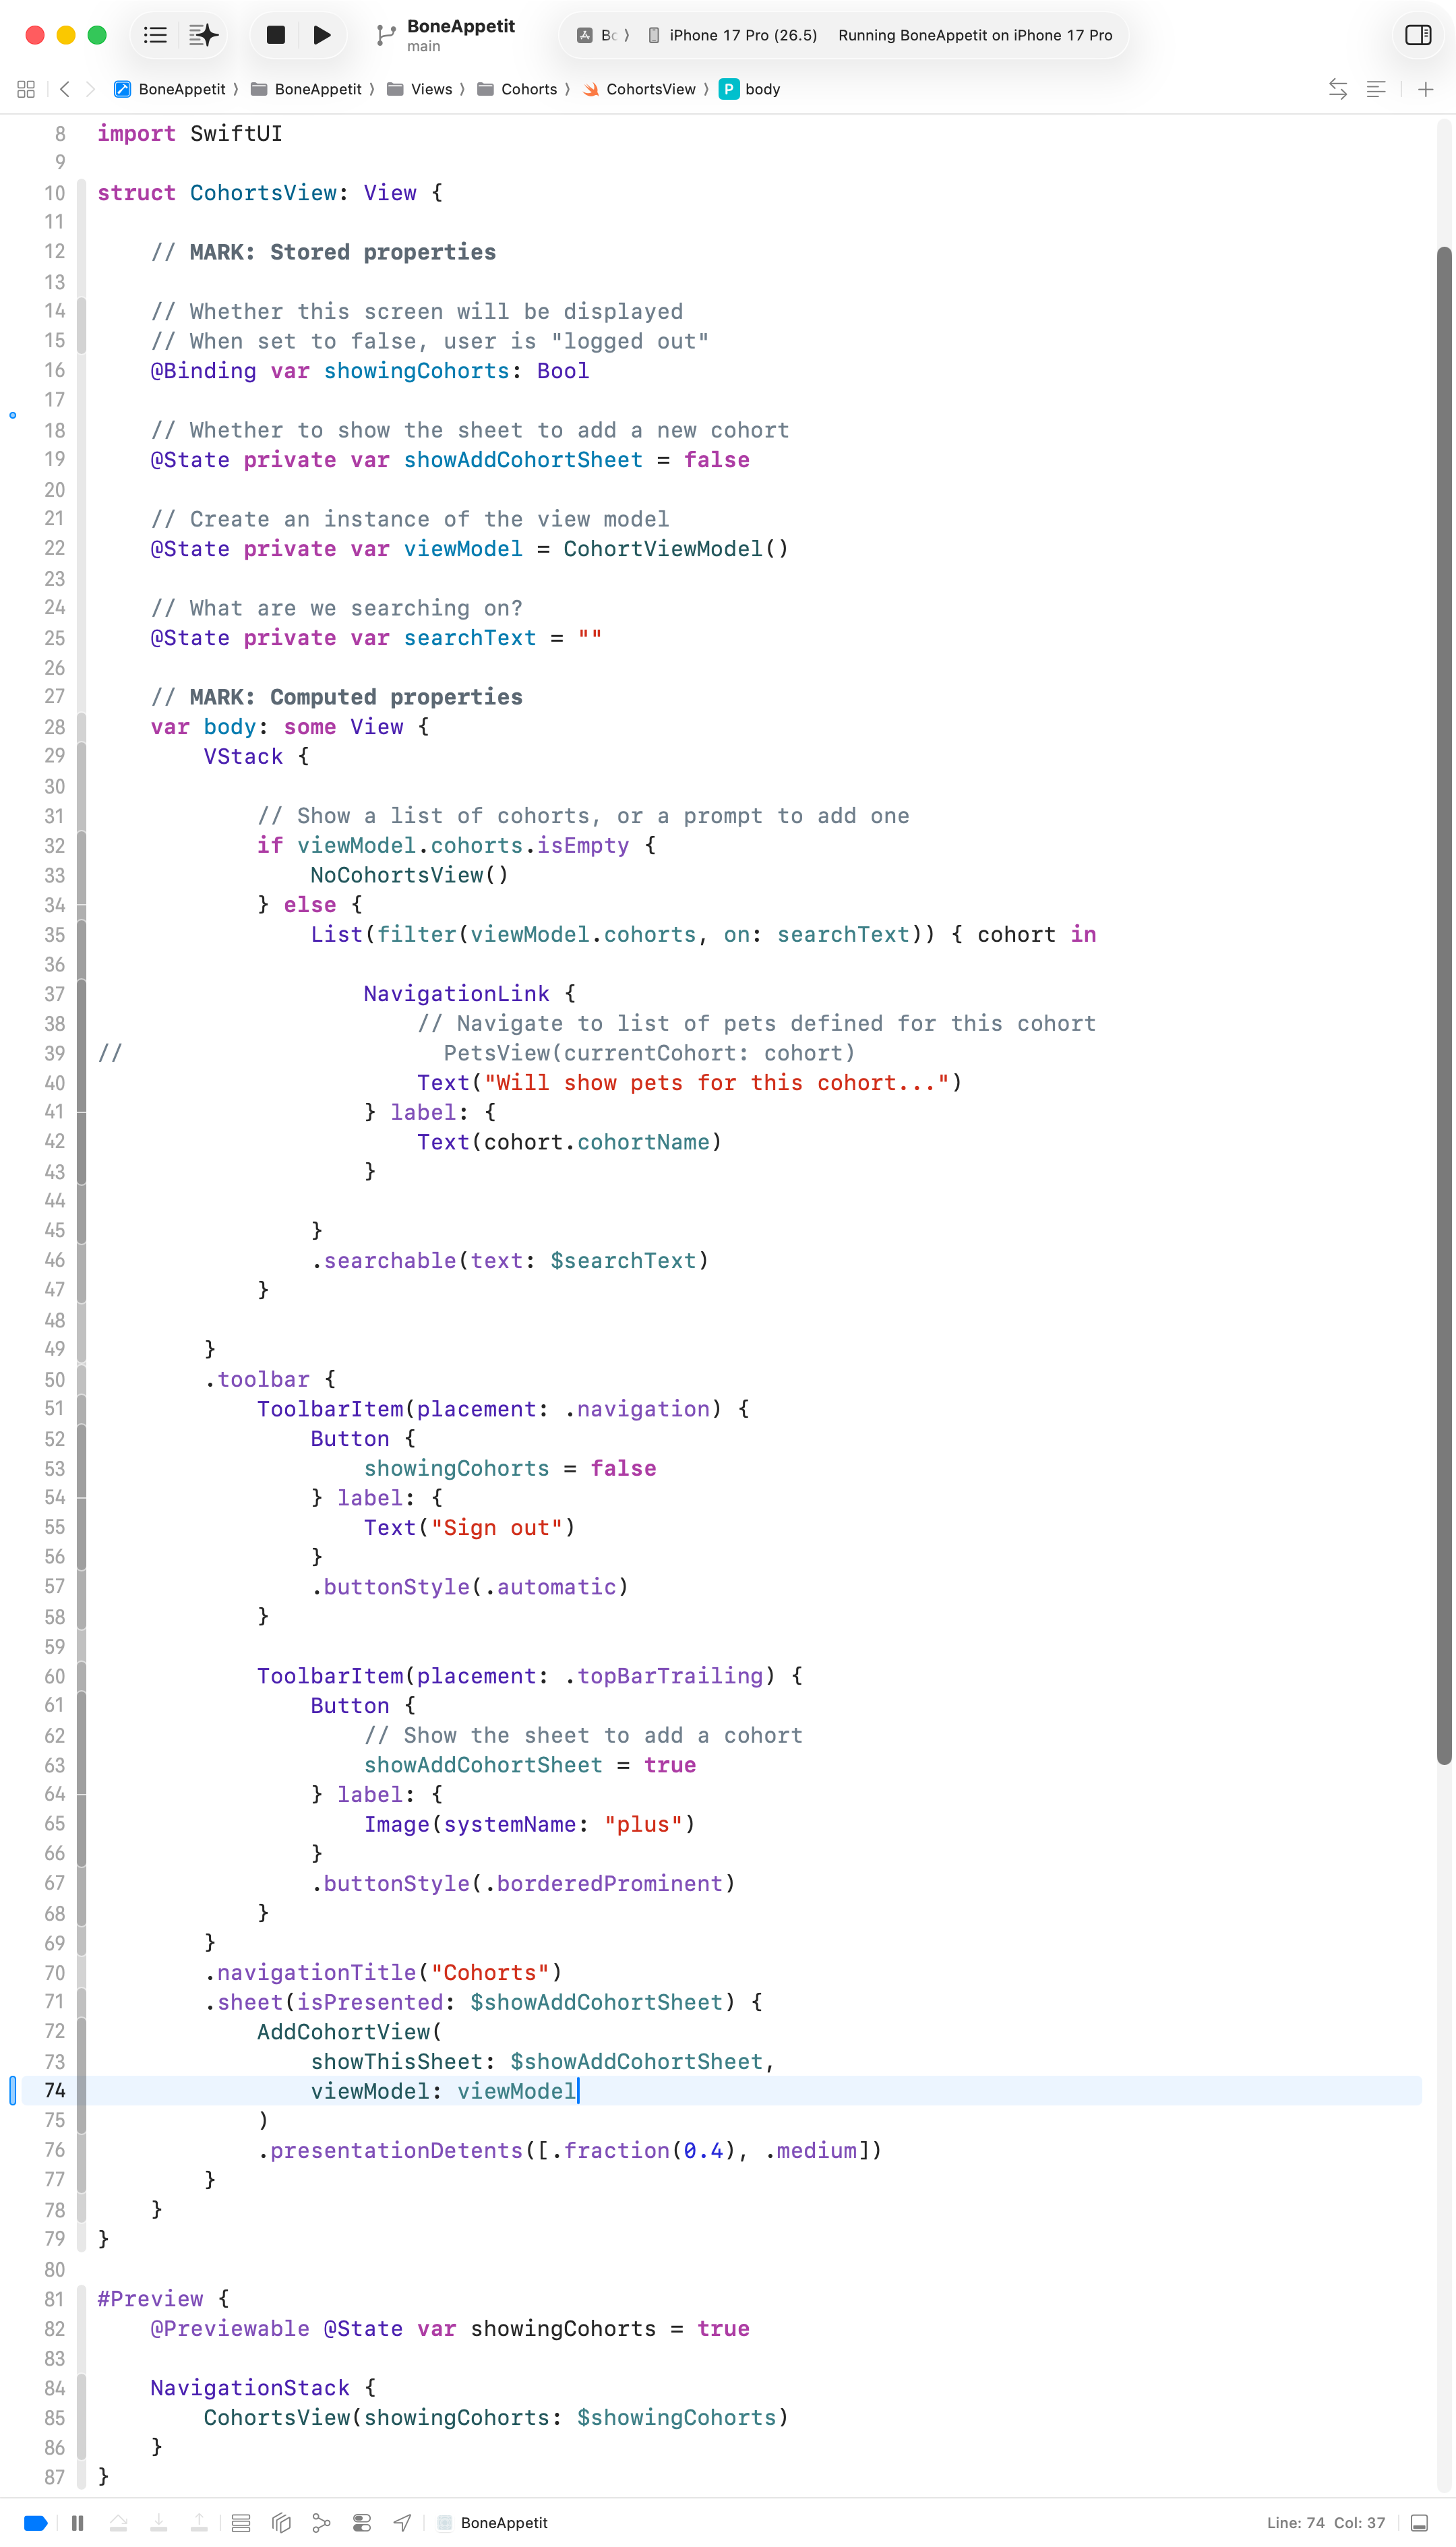
These are the changes to the view that shows the list of cohorts:
Here is what this looks like when run in the Simulator – note the log messages:
Communication
From the Ontario curriculum document for Computer Studies (2009), this entails:
The conveying of meaning through various forms:
- Expression and organization of ideas and information (e.g., clear expression, logical organization) in oral, visual, and written forms, including electronic forms (e.g., presentations, charts, graphs, tables, maps, models, web pages, reports)
- Communication for different audiences (e.g., peers, computer users, company supervisor) and purposes (e.g., to inform, to persuade) in oral, visual, and written forms, including electronic forms
- Use of conventions, vocabulary, and terminology of the discipline in oral, visual, and written forms, including electronic forms
Success criteria for this portion of the task:
- in writing, without assistance, you can:
- identify where an array and a function are used within code that you wrote without assistance
- describe how the array is initialized and modified using a function
- describe how sequence, selection, and iteration are used within a function
- in an end-of-year 10-minute interview:
- you can confidently describe how the significant portions of code in your group’s app works
- you can otherwise make the case for having met the overall learning goals of the course, including effective collaboration within a team
TIP
We will practice responses related to these topics in a different exercise this week in class.